Natural Gas and Oil Forecast: US Stock Decline Spurs Price Surge; Buy Today?
Market Overview
Wednesday’s oil prices edged higher after unexpected U.S. crude stock reductions suggested strong demand, juxtaposed with ongoing Middle East tensions. Contrary to forecasts of an 800,000 barrel increase, API data revealed a decrease of over 3 million barrels for the week ending April 19.
A dip in U.S. business activity to a four-month low implies potential rate cuts, potentially spurring oil demand from the top global consumer. While the Middle East conflicts continue, current impacts on oil supplies are minimal, with new sanctions against Iran on the horizon but not immediately affecting supply.
This scenario may influence the natural gas and oil forecast, with official U.S. stockpile data pending.
Natural Gas Price Forecast
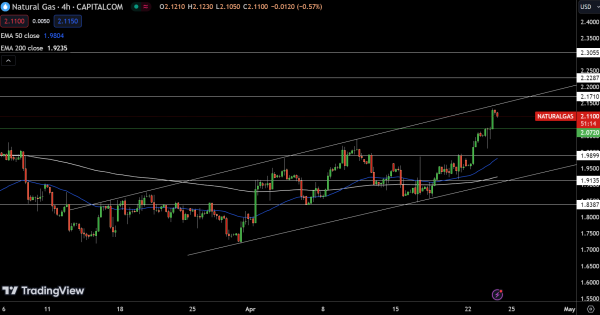
Natural Gas (NG)‘s market price has slightly decreased by 0.75%, settling at $2.11. Over a four-hour chart timeframe, the pivot point stands at $2.07, indicating a decisive level for traders. Resistance levels are noted at $2.17, $2.23, and $2.31, suggesting areas where selling pressure might intensify. Conversely, support can be found at $1.99, with additional levels at $1.91 and $1.84 potentially halting further declines.
The 50-Day and 200-Day Exponential Moving Averages (EMA) are situated at $1.98 and $1.92, respectively, providing a backdrop for the current pricing trend. The technical prognosis for Natural Gas hints at a bullish sentiment above the $2.07 mark. Nonetheless, falling below could trigger a pronounced downtrend.
WTI Oil Price Forecast
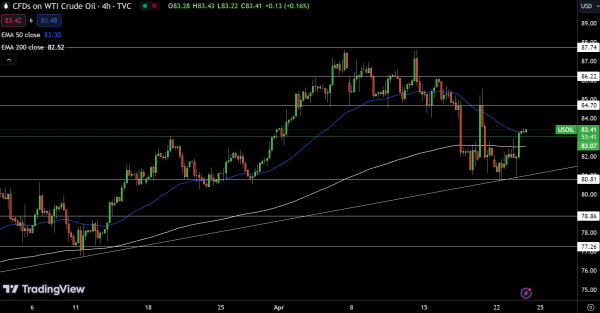
In today’s market, USOIL edged up modestly by 0.20%, with a current price of $83.50. On a four-hour chart, the pivot point is marked at $83.41, serving as a barometer for future price direction.
Should prices ascend, the asset faces resistance at $84.70, followed by $86.22 and $87.74, which could impede further gains. On the downside, support is observed at $80.81, with additional support levels at $78.86 and $77.26, potentially providing a rebound point.
Technical indicators reveal that the 50-Day and 200-Day Exponential Moving Averages (EMA) are at $83.30 and $82.52, respectively, endorsing the current uptrend. The technical outlook for US Oil remains bullish as long as prices stay above the pivot point of $83.41. Crossing below this threshold may initiate a strong selling pressure.
Brent Oil Price Forecast
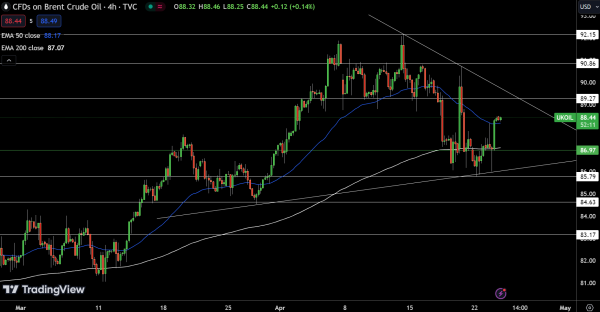
UKOIL has seen a slight uptick, with its price increasing by 0.14% to $88.51. The pivot point, delineated by the green line at $86.97 on a four-hour chart, is pivotal for determining the trend direction. Resistance is forming at $89.27, with subsequent levels at $90.86 and $92.15 potentially challenging bullish advances.
Conversely, support levels lie at $85.79, $84.63, and $83.17, which may provide a cushion if downward movement occurs. The 50-Day and 200-Day Exponential Moving Averages stand at $88.17 and $87.07, respectively, signaling a bullish trend is intact. The outlook for UK Oil remains positive as it trades above the pivot point of $86.97.
For a look at all of today’s economic events, check out our economic calendar.