Natural Gas and Oil Forecast: Will Brent Crude Break Above $75 or Test New Lows?
Market Overview
Oil prices edged higher after a significant decline earlier in the week, driven by geopolitical tensions and concerns over potential disruptions to energy infrastructure. Brent crude rose above $74 a barrel, while West Texas Intermediate hovered near $71.
Market volatility has been influenced by tensions in key regions and China’s efforts to boost demand, the world’s largest oil importer.
Additionally, the International Energy Agency’s forecast of a potential oil surplus next year has added to market uncertainty. Traders are now focused on U.S. stockpile reports for further insight into consumption trends.
Natural Gas Price Forecast
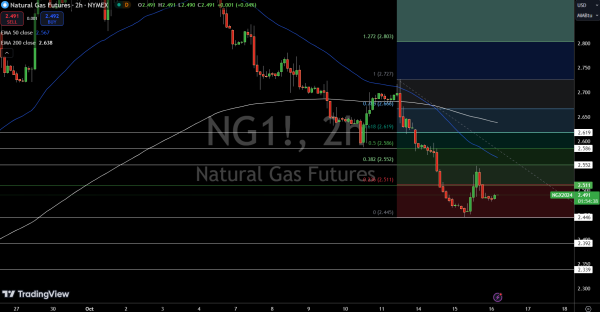
Natural Gas (NG)s is trading at $2.79, up slightly by 0.29%, but it’s been in a clear downtrend recently. On the 4-hour chart, we’re seeing some consolidation within a tight range. Key levels to watch include support at $2.45 and resistance at $2.55, which also coincides with the 38.2% Fibonacci retracement level.
This means that the market has retraced about 38% of its recent decline, potentially setting up for more movement. The 50-period EMA at $2.57 and the 200-period EMA at $2.64 suggest bearish pressure remains strong.
If prices dip below $2.45, we could see a sharp sell-off, but a break above $2.55 would signal a possible reversal. Keep an eye on these levels for the next move.
WTI Oil Price Forecast
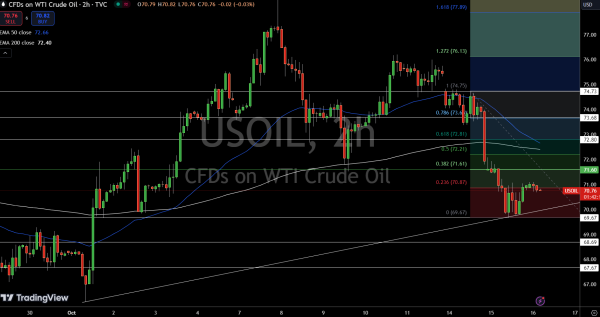
USOIL is trading at $70.80, down 0.23%, and the market has been steadily moving lower over the past few sessions. On the 4-hour chart, we’ve just completed a 23.6% Fibonacci retracement near the $71 mark, hinting at some temporary stability.
Right now, the price is caught between a solid support level at $69.67 and resistance at $71.60, which also acts as a pivot point. The 50-period EMA at $72.66 and 200-period EMA at $72.40 suggest that bearish momentum is still in play.
If oil breaks below $69.67, we could see a sharper sell-off, but a move above $71.60 could signal a shift toward more bullish sentiment. Keep an eye on these key levels.
Brent Oil Price Forecast
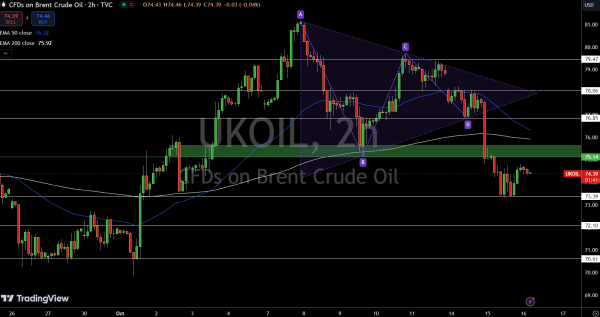
UKOIL is trading at $74.43, down 0.29%, as the market struggles to find direction amid broader economic uncertainties. On the 4-hour chart, we’re seeing prices consolidating below the pivot point at $75.14.
Immediate support sits at $73.39, which is a key level to watch—if prices fall below that, we could see a sharp move lower toward $72.10 or even $70.61.
Resistance is more distant, with the 50-period EMA at $76.32 and next major hurdles at $76.85 and $78.06. For now, the trend remains bearish, but a break above $75.14 could signal a reversal.
Traders should keep an eye on $73.39 as the line in the sand for further declines.