Natural Gas and Oil Forecast: Will OPEC+ Delay Boost Oil Prices Amid Bearish Trends?
Market Overview
Oil prices saw a slight recovery after hitting multi-month lows, driven by expectations that OPEC+ may delay its planned output increase and falling U.S. crude inventories.
The Organization of the Petroleum Exporting Countries (OPEC+) is reconsidering its scheduled October production hike due to weak Chinese demand and an easing of Libya’s export disruptions.
Data from the American Petroleum Institute (API) showed a significant 7.4 million-barrel drop in U.S. crude stocks, offering further support.
However, ongoing concerns about sluggish global demand, particularly from China, continue to limit price gains.
Natural Gas Price Forecast
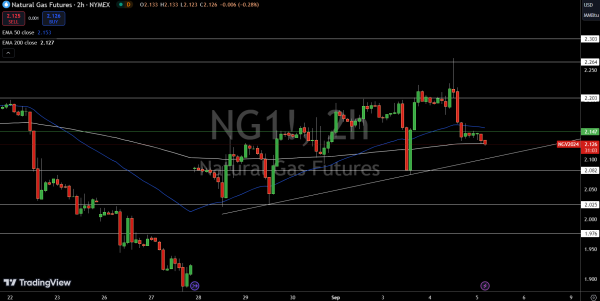
Natural Gas (NG) is trading at $2.25, down by 0.49%, indicating a bearish trend on the 4-hour chart. The price action shows a clear resistance at $2.147, with NG forming a bearish engulfing pattern. A string of doji candles that reflect market uncertainty but emphasize the possibility of further downside follow this pattern.
The $2.147 level is a critical pivot point, and as long as prices remain below this mark, natural gas is likely to face downward pressure. If the price breaks below immediate support at $2.10, which aligns with an upward trendline, it could trigger further declines toward $2.08.
In the event that this support is breached, the next downside target would be $2.02. However, should natural gas break above the $2.147 resistance, we could see a shift in momentum, with prices heading toward the next resistance level of $2.20 and beyond. The market remains bearish at this stage unless NG can push above $2.147.
WTI Oil Price Forecast
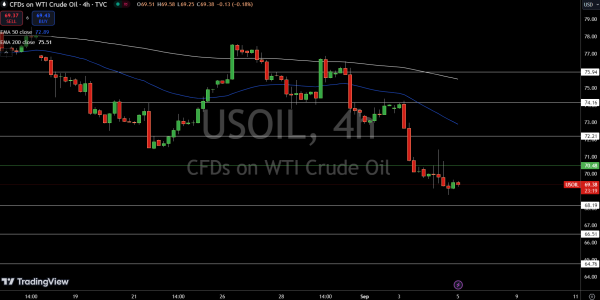
USOIL is trading at $69.40, up 0.34%, but facing key resistance at $70.48, which is a critical pivot point. Crude oil is in a consolidation phase, fluctuating between $71 on the upside and $68.85 on the lower side.
While oil hovers near oversold territory, the chances of a bullish reversal are strong. However, with the 50-day EMA at $72.89 and the 200-day EMA at $75.51 acting as higher resistance levels, the bearish sentiment remains dominant unless oil can decisively break above $71.
Immediate support lies at $68.19, and if breached, further downside could target $66.51 and $64.76. USOIL remains bearish, below $70.50 for now, but a breakout above this level could signal a shift toward bullish momentum.
Brent Oil Price Forecast
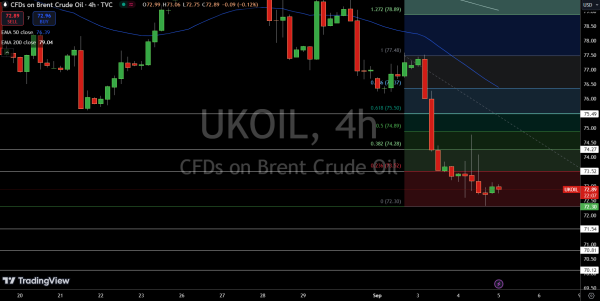
UKOIL is trading at $72.91, up 0.25%, but the key pivot point at $72.30 remains crucial for its short-term outlook. The immediate resistance sits at $73.52, followed by stronger barriers at $74.27 and $75.49. On the downside, immediate support is found at $71.54, with further support levels at $70.81 and $70.12.
UKOIL’s 50-day EMA is positioned at $76.39, and the 200-day EMA stands at $79.04, indicating that the bearish trend remains dominant unless prices can break higher.
If the price closes below $72.30, a bearish continuation could follow, but a more bullish scenario could unfold if it breaks above this level. As of now, the bearish bias persists.