Natural Gas and Oil Forecast: Will Supply Concerns Counteract China’s Demand Slowdown?
Market Overview
After a 7% surge over the last three sessions, oil prices have retreated, reflecting market concerns about potential supply disruptions. The spike was driven by escalating geopolitical tensions in the Middle East and the possibility of a Libyan oil field shutdown. These developments heightened fears of a broader conflict that could impact the region’s oil supply.
Although bearish sentiment around global oil demand, especially from China, could pressure prices, the looming supply disruptions from Libya may counterbalance this, preventing a significant price drop. This situation could influence the natural gas and oil forecasts by adding volatility and uncertainty to market expectations.
Natural Gas Price Forecast
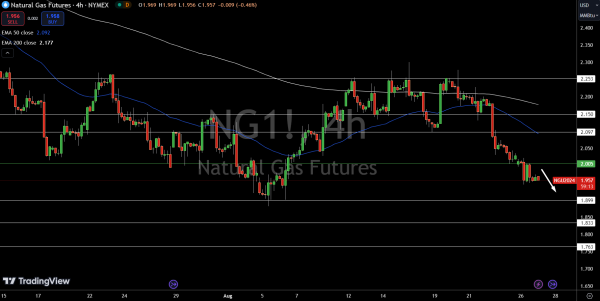
Natural Gas (NG) is currently priced at $1.957, slightly up by 0.05%. The key pivot point is $2.01. If the price remains below this level, we could see a bearish trend, with immediate support at $1.90, followed by $1.83 and $1.76.
On the upside, a break above $2.01 could trigger a bullish move, with immediate resistance at $2.10, then $2.15, and further up at $2.25.
The 50-day EMA is at $2.09, just below the 200-day EMA at $2.18, which suggests some bearish pressure. For now, the market remains bearish under $2.01, but if prices climb above that level, we could see renewed bullish momentum.
WTI Oil Price Forecast
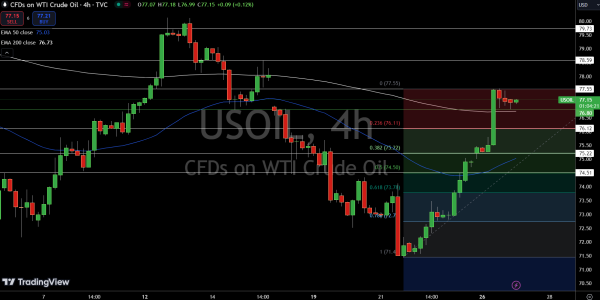
WTI crude oil (USOIL) is trading at $77.15, down slightly by 0.04%. The key pivot point to watch is $76.80. If prices stay above this level, we could see a bullish trend, with immediate resistance at $77.55, followed by $78.59 and $79.73.
However, if the price falls below $76.80, it may trigger a sharper selling trend, with immediate support at $76.12 and further support levels at $75.22 and $74.51.
The 50-day EMA is sitting at $75.03, while the 200-day EMA is at $76.73, which provides some near-term guidance. The outlook is bullish as long as the price stays above $76.80, but a break below could lead to increased selling pressure.
Brent Oil Price Forecast
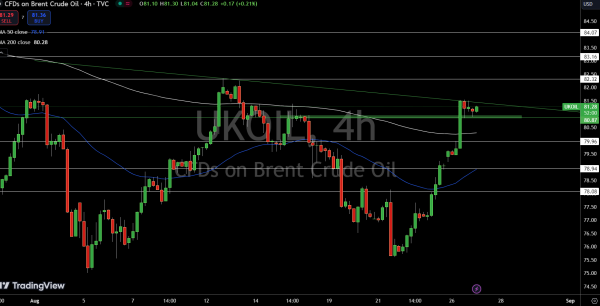
Brent oil (UKOIL) is currently priced at $81.28, down by 0.10%. The key level to keep an eye on is the pivot point at $80.87. If the price stays above this level, we might see a bullish move with immediate resistance at $82.32, followed by $83.16 and $84.07.
On the downside, if UKOIL breaks below $80.87, it could trigger a sharper sell-off, with immediate support at $79.96 and further support levels at $78.94 and $78.08.
The 50-day EMA is at $78.91, providing near-term support, while the 200-day EMA at $80.28 will be crucial in determining the overall trend. The outlook is bullish as long as prices remain above $80.87, but a break below could signal more selling pressure.