Natural Gas and Oil Forecast: WTI and Brent at Crucial Fibonacci Levels—What’s Next?
Market Overview
Oil prices rebounded on Wednesday following a significant drop in the previous session that ended a three-day streak of gains. The market was initially weighed down by concerns over global fuel demand and lower refinery profit margins, leading to a 2% decline.
However, the rebound was supported by falling U.S. oil and fuel inventories, alongside ongoing geopolitical tensions in the Middle East and potential supply disruptions in Libya.
The American Petroleum Institute reported a decrease in crude oil inventories by 3.407 million barrels, which, combined with geopolitical risks, could support higher oil prices.
Natural Gas Price Forecast
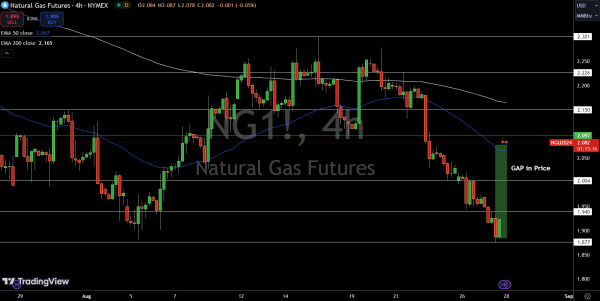
Natural Gas (NG) is currently trading at $2.08, up 0.09%. The price hovers near the $2.10 pivot point, which also aligns with the 50-day EMA at $2.07, providing short-term support.
Immediate resistance lies at $2.15, with further resistance at $2.23 and $2.30. If the price breaks above $2.10, it could spark renewed bullish momentum. However, if it falls below $2.00, the next support levels are at $1.94 and $1.88, potentially leading to further downside pressure.
Natural Gas remains bearish below $2.10; a break above this level could shift the market towards a bullish trend, while failure to hold could trigger more selling.
WTI Oil Price Forecast
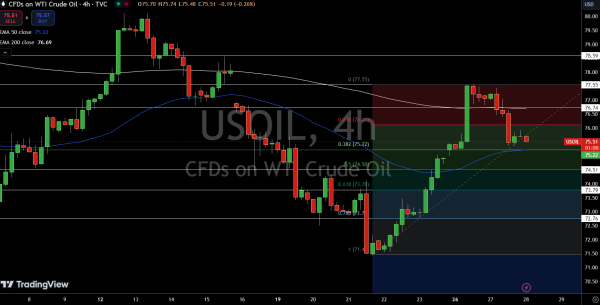
WTI Crude Oil is trading at $75.51, down 0.12%, with the price having completed a 38.2% Fibonacci retracement around the $75.22 level, where the 50-day EMA currently offers support.
If the price breaks below this level, it could open the door for further downside, targeting the 50% and 61.8% Fibonacci levels at $74.51 and $73.79, respectively.
Immediate resistance is found at $76.74, with further resistance at $77.55 and $78.59. A break above $75.22 could shift the bias back to bullish, while a sustained break below it could lead to more selling pressure.
Brent Oil Price Forecast
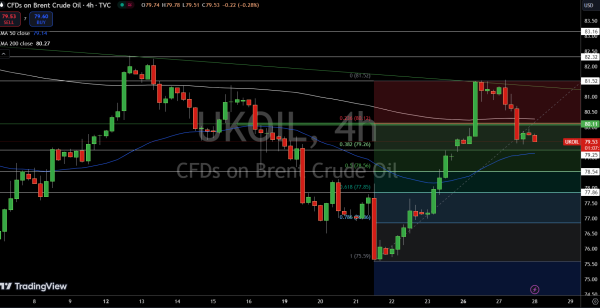
Brent Oil (UKOIL) is trading at $79.53, down 0.24%. The price recently completed a 23.6% Fibonacci retracement near the $80.11 level, with the 50-day EMA offering support around $79.14.
If Brent falls below this support, it could trigger further selling pressure, targeting the 38.2% and 50% Fibonacci levels at $79.26 and $78.54, respectively.
Immediate resistance is $81.52, with additional resistance levels at $82.32 and $83.16. If the price breaks above $80.11, we could see a shift toward a more bullish outlook.