Natural Gas and Oil Forecast: WTI Clings to $77; Can the Trendline Fuel Gains?
Market Overview
Oil prices are set for a second consecutive weekly gain, despite a slight dip on Friday. This increase is driven by better-than-expected U.S. retail sales and lower-than-anticipated unemployment claims, signalling strong economic growth in the world’s largest oil consumer.
Analysts note that supply concerns and positive economic data have bolstered investor sentiment. However, Chinese refineries have reduced crude processing due to weak fuel demand, capping further price increases.
These developments suggest a cautiously optimistic outlook for both oil and natural gas markets, with geopolitical tensions and economic indicators playing key roles in future price movements.
Natural Gas Price Forecast
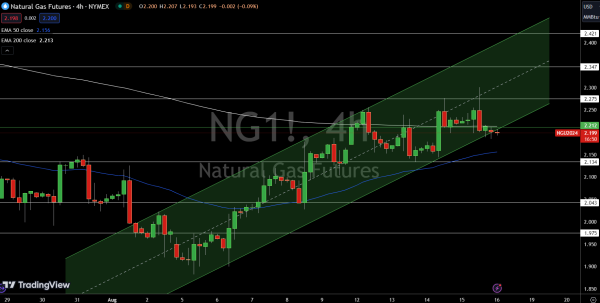
Natural Gas (NG) is trading at $2.199, down 0.26% for the day. On the 4-hour chart, the price is hovering just below the pivot point at $2.21, indicating potential bearish momentum. Immediate resistance stands at $2.28, with further levels at $2.35 and $2.42.
The 50-day EMA is positioned at $2.16, providing some support, but the 200-day EMA at $2.21 is a key level that the market is currently testing. A break below the $2.21 level could signal further downside, with immediate support at $2.13 and additional levels at $2.04 and $1.98.
The upward channel that previously supported NG appears to be breaking down, and crossing below the 200 EMA is reinforcing a bearish outlook.
WTI Oil Price Forecast
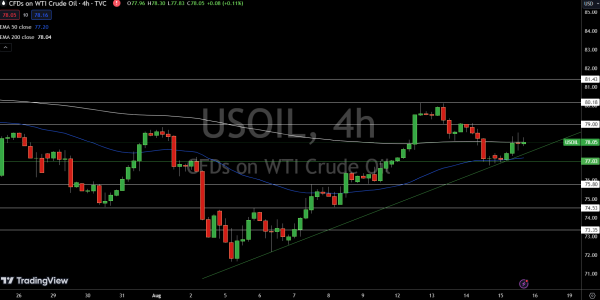
WTI Crude Oil (USOIL) is trading at $80.72, down 0.23% for the day. On the 4-hour chart, the price is supported by an upward trendline, holding just below the pivot point at $81.27.
This suggests a cautious bullish outlook. Immediate resistance is seen at $82.31, with further targets at $83.49 and $84.45. The 50-day EMA at $80.04 offers additional support, while the 200-day EMA at $81.27 is a critical resistance point.
A break above $81.27 could boost bullish momentum, but a failure to hold this level might lead to a decline toward $79.57 and $78.69.
Brent Oil Price Forecast
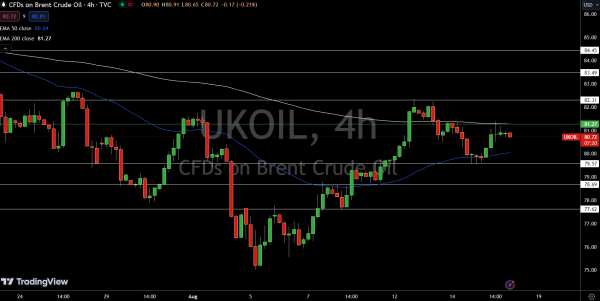
Brent Oil (UKOIL) is currently trading at $80.72, down 0.23% on the day. On the 4-hour chart, the price is sitting just below the pivot point at $81.27, signalling a potential bearish trend if it fails to break higher. Immediate resistance lies at $82.31, with further levels at $83.49 and $84.45.
The 50-day EMA is at $80.04, offering some support, but the 200-day EMA at $81.27 is acting as a critical resistance level.
If Brent Oil breaks below the immediate support at $79.57, we could see further declines toward $78.69 and $77.62. However, a break above $81.27 could shift the momentum to the upside, boosting the chances of a bullish continuation.