Natural Gas and Oil Forecast: WTI Eyes $77.25; Will Trendline Support Spark a Buy?
Market Overview
Oil prices rose slightly on Thursday, driven by optimism that potential U.S. interest rate cuts could stimulate economic activity and fuel demand. This followed a more than 1% drop on Wednesday, prompted by an unexpected rise in U.S. crude inventories and easing fears of broader conflict in the Middle East.
Despite the recent uptick, concerns over sluggish global demand, particularly from China, continue to weigh on the market. The possibility of geopolitical tensions, particularly related to Iran, adds further uncertainty.
These developments suggest that while there may be short-term support, the outlook for both oil and natural gas remains cautious.
Natural Gas Price Forecast
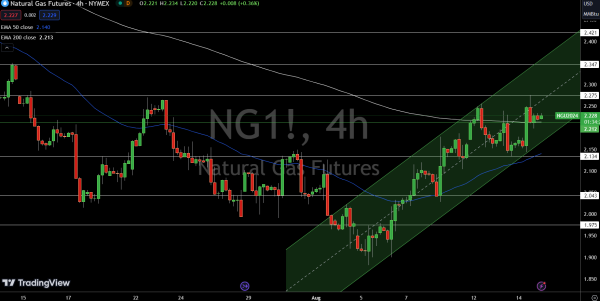
Natural Gas (NG) is trading at $2.29, down 0.22% on the day, but the price action suggests potential for a continued uptrend. The upward channel is providing solid support near the $2.21 pivot point, a critical level to watch.
Candles forming above both the 50-day EMA at $2.14 and the 200-day EMA at $2.21 further strengthen the bullish case. Immediate resistance is at $2.28, followed by $2.35 and $2.42.
If the price holds above $2.21, the uptrend is likely to continue, but a break below this level could trigger sharp selling pressure.
WTI Oil Price Forecast
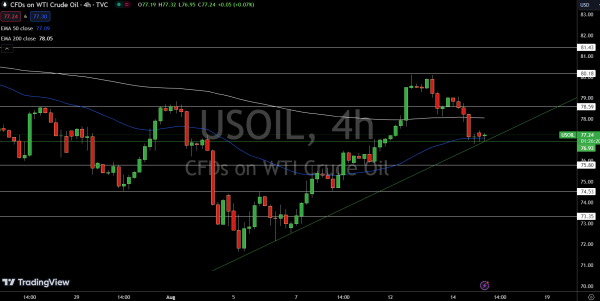
USOIL is trading at $77.22, down 0.09%, but the setup suggests a potential bullish reversal. The price is finding strong support near $77.24, where the upper trendline aligns with the formation of both a doji and a hammer candle—both typically signaling a reversal.
The 50-day EMA at $77.09 is also providing additional support on the 4-hour chart, reinforcing the likelihood of an upward move.
Immediate resistance levels to watch are $78.59, $80.18, and $81.43. If the price holds above the pivot at $76.93, we could see a continuation of the uptrend, but a break below could trigger sharp selling.
Brent Oil Price Forecast
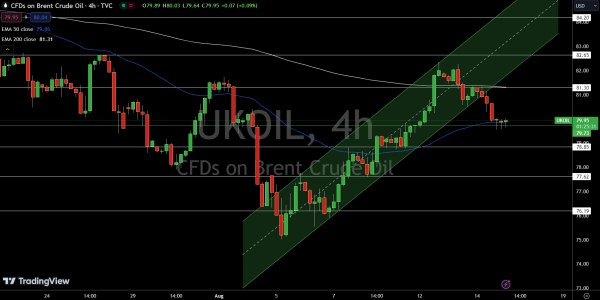
UKOIL is currently trading at $79.94, down 0.06%, but the technical setup suggests a potential upside. Similar to WTI crude, Brent oil is finding support near the $79.95 level, which is reinforced by the 50-day EMA at $79.86.
The formation of doji and hammer candles around this area indicates that selling pressure may be waning, with bulls potentially ready to take over.
However, the recent breakout from an ascending channel around $81 has turned that level into a significant resistance point, with additional hurdles at $82.65 and $84.20.
If prices hold above the pivot at $79.73, we could see a bullish continuation, but a break below could lead to further selling.