Natural Gas and Oil Forecast: WTI Falls to $75.33; Trendline Break Signals Bearish
Market Overview
Oil prices declined early Monday as worries over weakened demand in China, the world’s largest oil importer, weighed on market sentiment.
Last week’s nearly 2% drop in oil benchmarks reflected investors’ tempered expectations of Chinese demand growth, despite positive U.S. data showing moderate inflation and robust retail spending.
The market remains underpinned by geopolitical tensions, particularly in the Middle East and the ongoing Russia-Ukraine conflict, which continue to pose supply risks.
Impact on Natural Gas and Oil Forecast: The persistent concerns about China’s economic slowdown, alongside geopolitical tensions, suggest a cautious outlook for both natural gas and oil, with potential downside pressure on prices.
Natural Gas Price Forecast
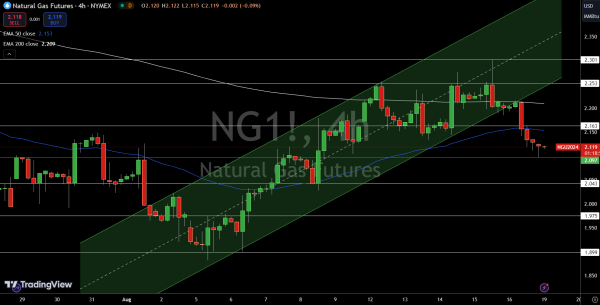
Natural Gas (NG) is currently trading at $2.119, slightly down by 0.05%. The chart reveals a potential bullish reversal, with the price hovering just above the pivot point at $2.10. The presence of Doji and Hammer candlestick patterns near this level suggests that the selling pressure may be weakening, and buyers could soon take control.
Immediate resistance is found at $2.16, with further resistance at $2.25 and $2.30. On the downside, support levels to watch are $2.04, followed by $1.98 and $1.90.
Conclusion: The outlook is bullish as long as NG holds above $2.10. However, a break below this pivot could trigger a sharp selling trend.
WTI Oil Price Forecast
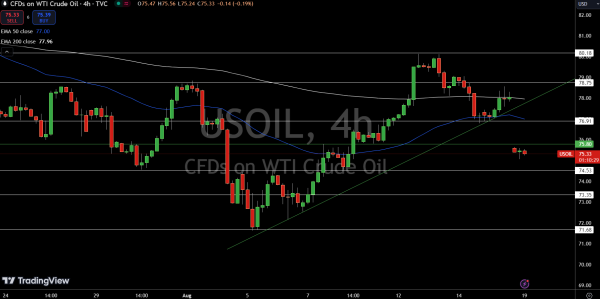
WTI Crude Oil (USOIL) is currently trading at $75.33, showing a slight decline of 0.02%. The chart analysis reveals a bearish outlook, particularly after an upward trendline was breached. The 50-day Exponential Moving Average (EMA) at $77.00 has crossed below the 200-day EMA at $77.96, forming a bearish crossover, which often signals a continuation of the downward trend.
Immediate support is found at $74.53, with additional support levels at $73.35 and $71.68. On the upside, resistance is likely around the pivot point at $75.80, with further resistance levels at $76.91, $78.75, and $80.18.
Given the current setup, the outlook remains bearish as long as USOIL stays below $75.80.
Brent Oil Price Forecast
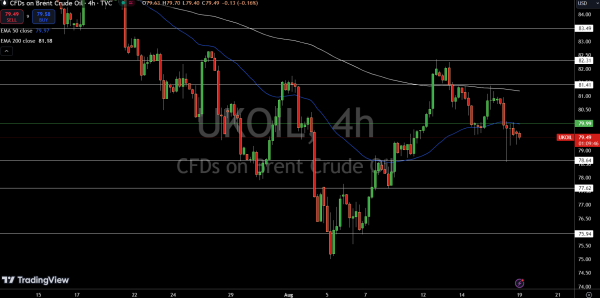
Brent Oil (UKOIL) is currently trading at $79.49, slightly down by 0.01%. The chart indicates a bearish outlook, particularly after the price broke below an upward trendline.
The 50-day Exponential Moving Average (EMA) at $79.97 has crossed below the 200-day EMA at $81.18, forming a bearish crossover, which typically signals further downside.
Immediate support lies at $78.64, with additional support at $77.62 and $75.94. On the upside, resistance is at the pivot point of $79.99, followed by $81.41, $82.31, and $83.49.
The market remains bearish below $79.99, but a break above this level could shift momentum, suggesting a potential reversal.