Natural Gas and Oil Forecast: WTI Nears $79; Upward Channel Signals a Buy?
Market Overview
Oil prices rose on Wednesday, driven by a larger-than-expected draw in U.S. stockpiles, as reported by the American Petroleum Institute. U.S. oil inventories dropped by 5.2 million barrels in the week ending August 10, far exceeding expectations of a 2 million barrel decrease.
This robust demand, despite the end of the travel-heavy season, overshadowed concerns over a reduced oil demand forecast for 2024.
Additionally, soft inflation data fueled hopes for deeper interest rate cuts by the Federal Reserve, creating a more positive outlook for oil and natural gas markets amidst ongoing geopolitical tensions.
Natural Gas Price Forecast
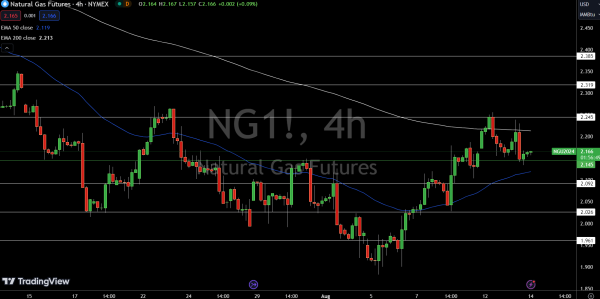
Natural Gas (NG) is currently priced at $2.16, slightly down by 0.04%. The price is positioned just above the pivot point at $2.15, a key level to monitor. Immediate resistance lies at $2.25, with further resistance at $2.32 and $2.39.
On the support side, levels are set at $2.09, $2.03, and $1.96. The 50-day EMA stands at $2.12, while the 200-day EMA is at $2.21, indicating mixed market sentiment.
The price’s hold above $2.15 suggests a potential continuation of the bullish trend, but a drop below this level could signal a shift towards bearish momentum.
WTI Oil Price Forecast
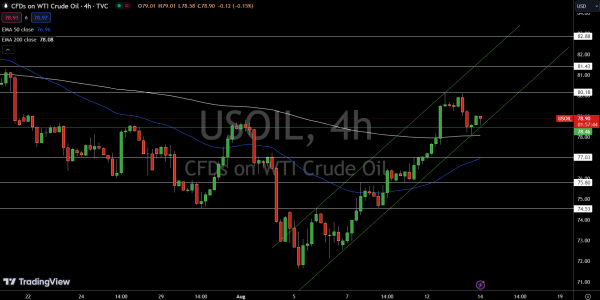
WTI Crude Oil (USOIL) is currently trading at $78.90, slightly up by 0.12%. The price is holding above the pivot point at $78.46, which is a key level to watch. With immediate resistance at $80.18 and further resistance levels at $81.43 and $82.88, the upward trend seems intact.
Support is found at $77.03, with additional support at $75.80 and $74.53. The 50-day EMA is at $76.96, and the 200-day EMA at $78.08, both supporting the bullish outlook.
The formation of a bullish engulfing pattern on the 4-hour chart strengthens the likelihood of continued upward movement. A break below $78.46 could signal a bearish shift.
Brent Oil Price Forecast
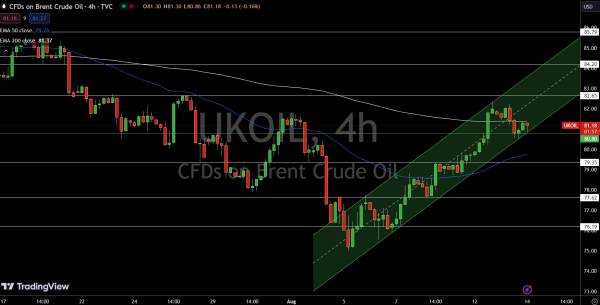
Brent crude (UKOIL) is trading at $81.18, slightly down by 0.01%. The price is hovering near the pivot point at $80.80, which is crucial for determining the next move. Immediate resistance is at $82.65, with further resistance at $84.20 and $85.79.
On the downside, support levels are at $79.35, $77.62, and $76.19. The 50-day EMA is at $79.76, and the 200-day EMA is at $81.37, providing mixed signals.
Despite the slight dip, the price remains above the key support at $80.80, suggesting the potential for continued upward momentum unless it breaks below this level, which could trigger a sell-off.