Natural Gas and Oil Forecast: WTI Targets $71.40 Rebound, Double Bottom Alert
Market Overview
Oil prices fell for the fifth consecutive session on Thursday due to global demand concerns, despite a drop in U.S. fuel inventories. Since August 15, the front-month WTI contract for October has declined by 6.9%, while Brent futures have fallen by 6.4%.
Weak economic data from the U.S. and China, coupled with fears that OPEC+ may reverse output cuts in October, have contributed to this downturn.
Although U.S. inventories have decreased, the potential for increased OPEC+ supply and ongoing geopolitical uncertainties are likely to keep oil prices under pressure, impacting both oil and natural gas forecasts.
Natural Gas Price Forecast
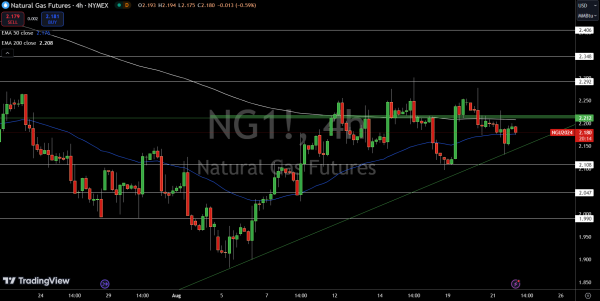
Natural Gas (NG) is currently finding support near $2.15, with an upward trendline offering additional strength. The immediate resistance sits at $2.21, which acts as a key pivot point. A break above this level could trigger a bullish trend, potentially pushing prices toward the next resistance levels at $2.29, $2.35, and $2.41.
On the downside, support levels are at $2.11, $2.05, and $1.99, with the 50-day Exponential Moving Average (EMA) at $2.18 and the 200-day EMA at $2.21. These levels will play a crucial role in determining the market’s direction.
Conclusion: Bearish below $2.21; a break above this level could signal a bullish trend.
WTI Oil Price Forecast
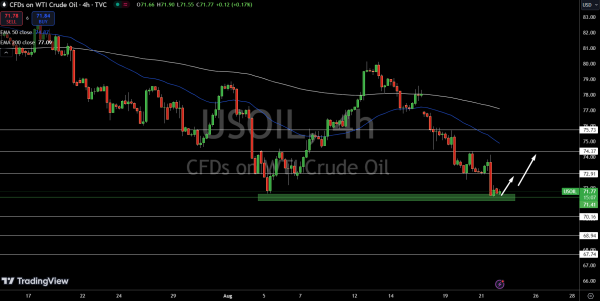
On the 4-hour chart, WTI Crude Oil (USOIL) is showing signs of support near the $71.40 level, where a double bottom pattern is forming. This pattern typically signals a potential reversal in trend, especially if candles close above this key level. Immediate resistance is at $72.91, with further resistance at $74.37 and $75.73. On the downside, key support levels to watch are $70.16, $68.94, and $67.74.
The 50-day Exponential Moving Average (EMA) at $74.87 suggests a bearish trend, but a close above $71.41 could shift momentum towards a bullish reversal.
Conclusion: Bullish above $71.41; a break below this level could lead to sharp selling.
Brent Oil Price Forecast
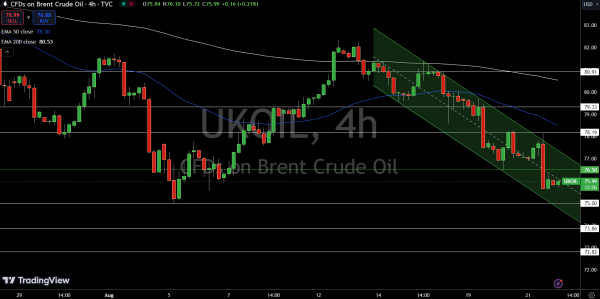
Brent Oil (UKOIL) continues to face pressure from a downward channel, with immediate resistance at $76.50. This level acts as a pivot, and if prices remain below it, the bearish trend is likely to persist. Resistance levels to watch are $78.19, $79.33, and $80.91. On the downside, immediate support sits at $75.00, with further levels at $73.86 and $72.82.
The 50-day Exponential Moving Average (EMA) at $78.50 and the 200-day EMA at $80.53 both suggest a bearish outlook unless Brent breaks above $76.50, which could spark a shift towards a bullish trend.
Conclusion: Bearish below $76.50; a break above could signal a bullish reversal.