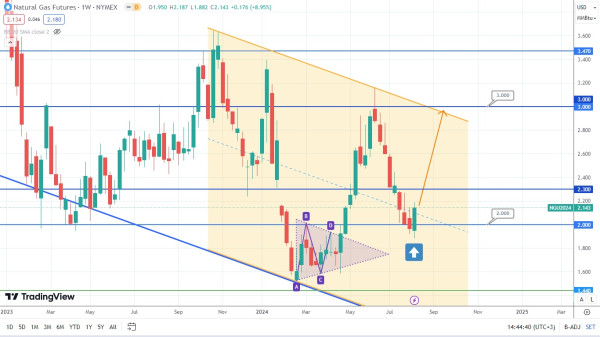
Natural Gas Forecast: Potential Price Rise Ahead
The price of natural gas has formed an engulfing at the end of the last trading week. This engulfing is touching a very strong psychological support level of 2.00. The combination of the candlesticks and technical trendlines on the chart below signifies potential price growth. The price of this asset might potentially hit 3.00 in the upcoming weeks. So, let’s observe whether this scenario is going to work out.
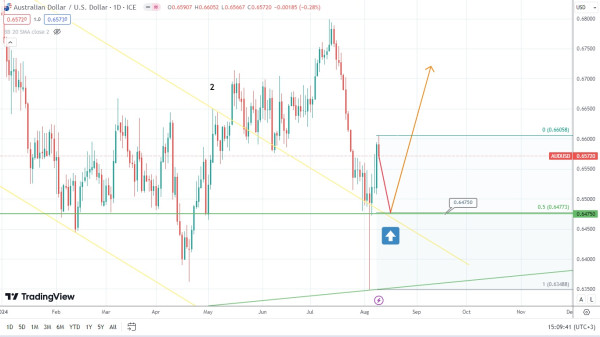
The price of the Australian dollar has repeatedly tested the broken downtrend, formed a candle with a long tail, and jumped. It is likely to undergo a correction at the beginning of the next trading week. Hence, the price of this asset might gain the required support at the level of 0.6475 and rise. So, let’s observe what the next price movement of the Australian dollar might be.
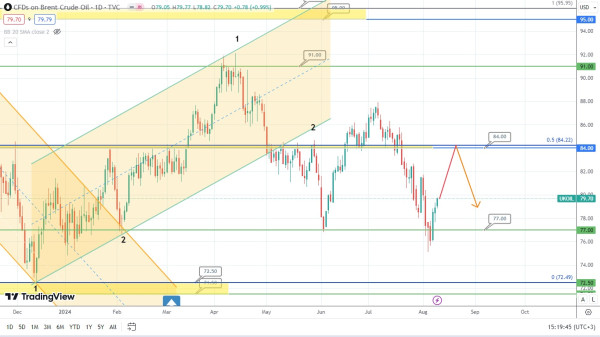
The price of Brent oil rebounded from the supporting level of 77.00. It is currently targeting resistance at the level of 84.00. The price of this asset won’t break this resistance. Therefore, the price of oil is likely to drop. In this case, it would also be important to follow the candlestick formations next to this resistance level to forecast the upcoming sentiment.