Natural Gas Price Forecast: Eyes 50-Day MA Amid Bullish Signals
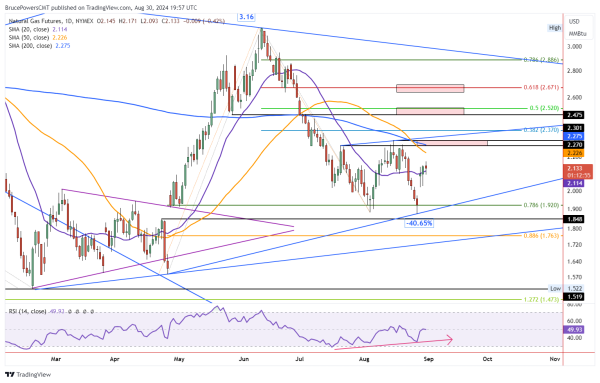
Natural gas rose on Friday to trigger a one-day continuation signal for the bull trend. Subsequently, resistance was seen at the day’s high of 2.17, leading to a pullback below the opening price of 2.145. At the time of this writing, it continues to trade below the open but a little above the 20-Day MA.
It has been flirting with the 20-Day line for several days. On Tuesday, natural gas closed at resistance of the 20-Day line and then clearly above it yesterday. If it can close above the 20-Day line today, a short-term bullish outlook can be maintained. Moreover, the week is set to end with a bullish green candlestick pattern, primed for upside follow-through next week
Watching for Progressive Signs of Strength
There needs to be additional signs of strength following yesterday’s bullish breakout above the 20-Day MA to add confidence that an advance may be sustainable. A daily close above the 20-Day line would provide a new piece of evidence for a continuing bullish scenario, while a close below the line puts short-term price behavior into question as a pullback could be coming. It would also increase the possibility of an eventual failure of the bull breakout of the moving average line. This is particularly the case when Thursday’s close was strong, near the high of the day.
Double Bottom Breakout Potential
The price of natural gas looks to be heading to the 50-Day MA at 2.23 before it may encounter resistance. A key price level is the most recent swing high of 2.30 as it is part of the price structure of the downtrend. Once it is exceeded to the upside, a bullish trend reversal will be indicated. By then additional signs of strength will have occurred regarding the 200-Day MA, at 2.275 currently. In addition, an advance above the 2.30 swing high will trigger a bullish reversal of a double bottom pattern given that the second bottom was established this week.
A double bottom reversal pattern as it forms could see additional consolidation before a bullish breakout occurs. If resistance is seen around the price levels noted above, there could still be a bearish reversal and drop to lower price levels, and possibly the internal uptrend that is shown on the chart.
For a look at all of today’s economic events, check out our economic calendar.