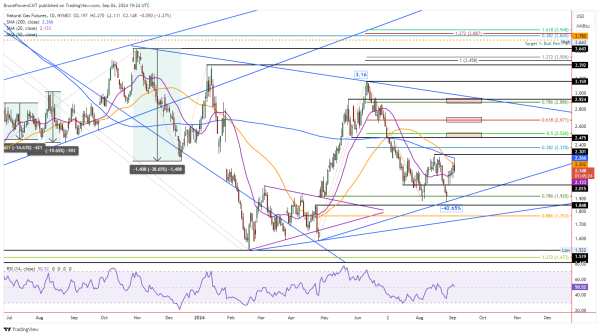
Natural Gas Price Forecast: Faces Key Resistance at 200-Day MA
Natural gas rose to a new high of 2.27 on Wednesday before pulling back intraday. The day’s high was a successful test of resistance at the 200-Day MA (blue). A breakout above the 50-Day MA (orange) occurred earlier in the session. However, natural gas is set to end down for the day and closing near session lows. But it remains above the 20-Day MA at 2.13 at the time of this writing.
This will leave it sandwiched between the resistance around the 200-Day MA at 2.27 and the 20-Day MA at 2.13, today’s low. Therefore, today’s price range provides two price levels to watch for clues as to what is next.
Near-term Support at 2.13
A breakdown from today’s low will also trigger a drop below the 20-Day line. The 20-Day line has a chance to maintain support as the trend advances. Nonetheless, a pullback may come first and the 2.13 price level is the area to watch. Some degree of a pullback or rest would not be a surprise given the advance and test of the 200-Day line. The question is whether a sustained breakout to recapture the 200-Day MA can occur with a short rest or will a longer period be needed. There was weekly support at 2.00 two weeks ago and it could be an area of support if a pullback develops.
Breakout Above 200-Day Line Points Higher
If the 200-Day line can be recaptured, natural gas will then have a chance to breakout above the developing double bottom bullish reversal pattern. The center and most recent swing high marks the breakout level at 2.30. Subsequently, the 38.2% retracement at 2.37 should be easily surpassed, leading to the 50% retracement target at 2.52. Three price levels for to eventually reach the 78.6% retracement at 28.89. That is right near the downtrend line that marks the top of a large symmetrical triangle pattern.
Double Bottom Potential
As the double bottom pattern continues to develop there could easily be pullbacks to further test support around the 20-Day line, as well as a potential support zone from the 2.015 swing low in mid-July. Otherwise, for the bullish near-term outlook to be sustained a pullback should not fall below the internal uptrend line.
For a look at all of today’s economic events, check out our economic calendar.