Natural Gas Price Forecast: Key Levels to Watch as Bear Trend Deepens
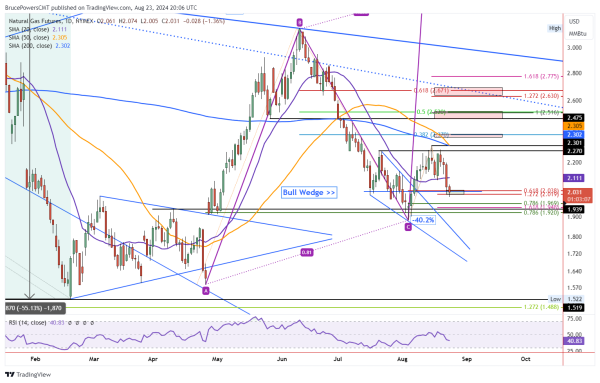
Natural gas continued its bearish correction on Friday with a drop to a new retracement low of 2.00 before finding support. The 61.8% Fibonacci retracement at 2.04 was exceeded to the downside and the 127.2% extended target for a falling ABCD pattern completed at 2.02. Neither managed to sustain support leaving open lower price levels.
At the time of this writing natural gas is on track to close weak, in the lower third of the day’s trading range. If the close today is similar, sellers will have dominated trading into the close and may do so again heading into next week.
Finishing Week in Bearish Position
Today’s bearish behavior in the price of natural gas improves the chance that it may be heading to lower price levels before the retracement is complete. In addition, on the weekly time frame a bearish weekly reversal triggered this week, and the week is set to end with a bearish red candlestick pattern and a close near the lows for the week. This will set up a bearish signal below this week’s low. The next lower price target is at the 78.6% Fibonacci retracement at 1.97. A little lower is the 161.8% extended target for a small declining ABCD pattern at 1.95.
Rally Above Today’s High Will Show Strength
Nonetheless, natural gas found support today at 2.00 and it could continue to hold above that price level leading to a bullish reversal. A rally above today’s high of 2.07 would be a sign of strength with natural gas first heading towards the 20-Day MA, now at 2.11. If the 20-Day line can be recaptured natural gas will have a chance to proceed higher.
Resistance at Moving Averages
The next higher key resistance zone that would need to be recaptured is the recent swing high and last week’s high of 2.30. However, there are two moving averages nearby that need to be considered as well. The 200-Day MA is also at 2.30 and the 50-Day MA is at 2.305. Therefore, recapturing the 2.30 high and moving averages will put natural gas in a position to proceed higher. Until then, they may continue to identify an area of potential resistance.
For a look at all of today’s economic events, check out our economic calendar.