Natural Gas Price Forecast: Poised for Breakout, Targets $2.72 Amid Uptrend
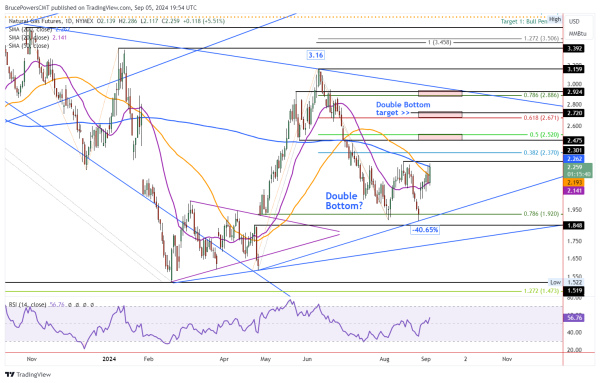
Natural gas continued to strengthen on Thursday as it again challenged resistance around the 200-Day MA. The day’s high at the time of this writing was 2.29 and the 200-Day line is at 2.26. This is constructive bullish progression of the developing uptrend and increases the chance for a further rise above the 200-Day line in the near-term. Support was seen yesterday at the 20-Day MA (purple). While natural gas dipped below it briefly today it is on track to close above it.
The 20-Day line is currently at 2.14, and it provides a good indication of support for the short-term trend. Natural gas is on track close strong for the day, in the top third of the day’s price range. The 200-Day line sits with yesterday’s high. Therefore, a daily close today above yesterday’s high of 2.27 will be a stronger indication than a close below 2.27.
Bullish Case Improves
As the bullish case for natural gas strengthens, a potential breakout of a double bottom pattern is on the horizon. A breakout is triggered with a decisive rally above the most recent swing high of 2.30 and it projects to a target around 2.72. The potential target is joined by the 61.8% Fibonacci retracement at 2.67 to generate a price zone from 2.67 to 2.72. On the way there, the 50% retracement is at 2.52 and natural gas may see signs of resistance in that area.
Strong Close Possible for the Week
On a weekly basis, natural gas is set to close at its highest weekly closing price in eight weeks. This will be another bullish indication and a sign that demand is improving. Natural gas has been consolidating within a large symmetrical triangle pattern. The lower end of the pattern was tested at the most recent swing low of 1.875.
Once one side of a consolidation pattern is reversed, the other end of the pattern becomes a target. For natural gas that would mean that an eventual test of resistance around the top line of the triangle is possible. As of today, the 78.6% retracement target at 2.89 can be used as a proxy for the top trendline.
For a look at all of today’s economic events, check out our economic calendar.