Natural Gas Price Forecast: Reaches Key Support, Eyes Reversal
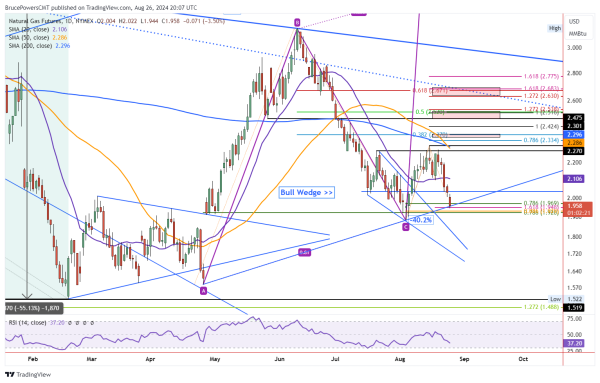
Lower prices were on the agenda for natural gas on Monday as it fell to a new retracement low of 1.94 before finding intraday support. Monday’s decline exceeded the 78.6% Fibonacci retracement at 1.97 and completed a descending ABCD pattern that is extended by the 161.8% golden ratio at 1.95. Those two price targets were mentioned previously, and they represent a maximum potential retracement before the chance of a bearish continuation to challenge support around recent lows of 1.88 increases.
Rising Trendlines Confirms Support Zone
Notice that a rising trendline starting from the April swing low identifies potential support around today’s low. Combined with the 161.8% ABCD target, natural gas has reached a price level where support may be strong enough to turn the price of natural gas back up. But first let’s look at the potential for further downside. A decline below today’s low of 1.94 will signal the possibility for a deeper bearish retracement.
The 88.6% retracement at 1.93 identifies the next lower target. If that price level fails to lead to a bullish reversal, the early-August swing low around 1.88 becomes a target and the potential for a bearish continuation below that price level increases. Also, notice that the orange 50-Day MA is beginning to dip below the blue 200-Day MA. This is a sign of weakening and the significance will depend on the follow-through to the downside or whether a bullish reversal takes command.
Bullish Reversal Above 2.02
On the upside, a potential one-day bullish reversal will be triggered on a rally above today’s high of 2.02. If triggered to the upside natural gas would next be heading towards potentially minor resistance around last Thursday’s low of 2.03, followed by the 20-Day MA at 2.105. The 20-Day line is key relative to the current chart pattern for natural gas. It maintained support for only a limited time recently following a rise back above the line on August 8. This week’s decline is a failure of support at the 20-Day line, and it follows months since June 26 when natural gas dropped back below the 20-Day MA.
For a look at all of today’s economic events, check out our economic calendar.