Natural Gas Price Forecast: Reverses Sharply from 20-Day MA Resistance
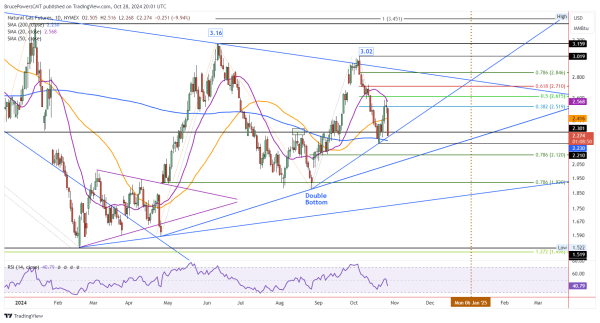
It looks like natural gas decided to spend more time testing recent support as it fell sharply towards the 200-Day MA on Monday before finding buyers at the day’s low of 2.27. That low was around an internal uptrend line and can be considered as a successful test of the internal uptrend line as support. Today’s low may be the end of the pullback, but the 200-Day MA is currently a little lower at 2.23 and may yet be tested as support more specifically.

Pullback From 20-Day MA
Today’s sharp bearish reversal triggered a decline below the inside day from Friday. Both last Friday and Thursday’s highs found resistance around the purple 20-Day MA, now at 2.57. That was the top of the counter-trend rally seen so far. There was concern discussed recently about potential resistance around the 20-Day line, and the bearish answer is now clear. However, how that plays out with the larger developing patterns remains to be seen.
Trades Within Weekly Range
The two key price levels to be aware of are last week’s high of 2.58 and low of 2.21. Until then, natural gas is consolidating within last week’s price range when considered on a weekly basis. Also, the market has clearly recognized the price zone represented by the 20-Day MA and therefore it may do so again. Although trendlines may not be too reliable on their own as a signal they can provide indications of improving or decreasing demand. So, the internal uptrend line can be watched in that regard. If there is a daily close below the line, the chance of a deeper pullback from there increases.
20-Day Line to Provide a Clue
A clear sign of strength will be given if the 20-Day line is recaptured. However, a daily close confirming the breakout will be needed to indicate that price is likely to continue to strengthen. Further, a rally above last week’s high is needed to provide a weekly bullish signal. Of course, that would also signal a breakout above the most recent swing high as seen on the daily chart and thereby trigger a continuation of the bull trend as it would signal a higher swing high.
For a look at all of today’s economic events, check out our economic calendar.