Natural Gas Price Forecast: Triggers Daily Bullish Reversal
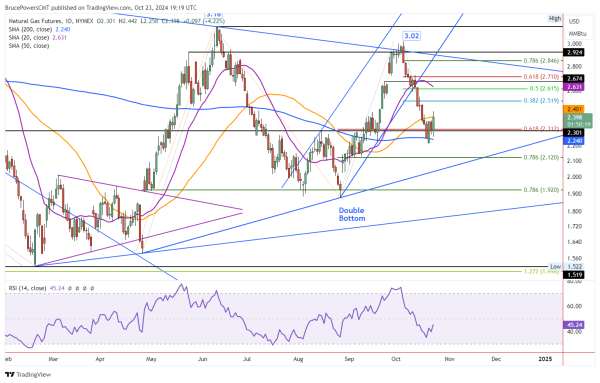
Natural gas triggered a bullish reversal on Wednesday as it broke out of a three-day price range to reach a high of 2.44 before encountering resistance. The advance broke out above the 50-Day line at 2.40, providing another sign of strength after the three-day high of 2.375 was breached. A daily close above the 50-Day line will confirm strength and put natural gas in a bullish position to continue to progress the counter-trend rally. A bullish reversal day first occurred last Friday but it needed upside follow-through as the advance quickly stalled.

Next Targets 2.52
A decisive breakout above 2.375 triggered and potential resistance around the 50-Day line was also exceeded. This opens the door to higher prices. The next upside target is the 38.2% Fibonacci retracement at 2.52, followed by the 50% retracement at 2.62. Notice that the purple 20-Day MA is heading towards the 50% retracement now and may soon converge with the line. Consequently, the two levels should be watched as a potential resistance zone unless the 20-Day line moves further away from the 50% retracement level.
20-Day MA is Key Resistance Area
The 20-Day MA is helpful for use with the short-term trend. Notice that natural gas initially stalled its decline from the 3.02 peak around the 20-Day MA. Once support failed to hold the decline continued and accelerated. Prior support is now potential resistance, and the 20-Day MA is a key potential resistance zone. Furthermore, a breakout and daily close above the 20-Day line is needed for further signs of strength that could lead to natural gas eventually challenging the top of a large symmetrical triangle pattern and the most recent swing high of 3.02. If the 2.62 level is exceeded, then the 61.8% Fibonacci retracement at 2.71 becomes the next target.
Potential to Eventually Challenge Top Trendline
An advance from current lows has the potential to eventually challenge resistance around the top trendline defining a large symmetrical triangle formation. The most recent attempted breakout failed after encountering resistance from the 3.02 swing high. Success might favor the next rally as the apex of the triangle is getting close and a breakout – up or down – is coming due.
For a look at all of today’s economic events, check out our economic calendar.