Natural Gas Price Forecast: Upside Breakout from Consolidation, Eyes Higher Levels
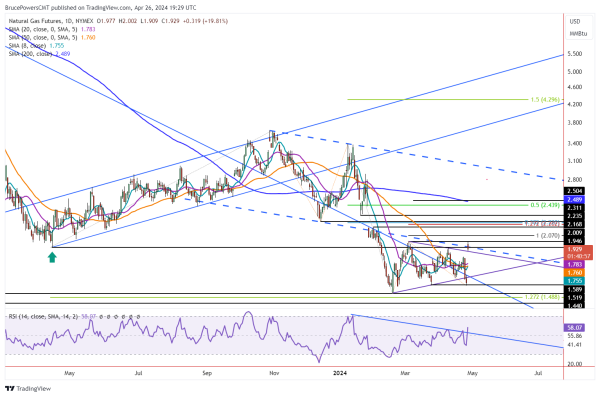
Natural gas reverses higher on Friday, following an initial breakdown from a symmetrical triangle consolidation pattern yesterday. The reversal triggered an upside breakout of the triangle with an advance above the 1.94 swing high from April 10. Resistance was seen just shy of the 2.01 swing high from March 5 at the day’s high of 2.00, leading to an intraday pullback.
A test of support around the top boundary line of the triangle is in process with a low for the day of 1.91, at the time of this writing. However, be aware that today’s gap up bullish reversal may be influenced by the change in the future’s contract as the chart shown is for continuous futures.
Out of Symmetrical Triangle, Eyes Higher Levels
The 1.94 swing high matches the previous trend low from April 2023 at 1.95. Therefore, it has some longer-term significance. It was exceeded to the upside over several days in early-March but there was no close above that price level. This means that a daily close above 1.95 will provide a sign of increasing demand and that a breakout above the 2.01 swing high is a bullish signal.
Also, notice that today’s advance exceeded the lower dashed blue declining parallel channel line, another sign of strength. Further, the trendline on the relative strength index momentum oscillator (RSI) was busted to the upside today. Nevertheless, what happens in the coming days will be more revealing than today’s price action.
Further Confirmation of Strength Needed
It doesn’t look like today will end above the 1.94 swing low. So, moving forward a daily close above that price level will provide confirmation of strength. And, on a daily close above the lower blue channel line, although it is more of a sign of strength rather than a reliable signal.
There are several upside price levels to watch, and more details will be discussed in the future. For now, the 38.2% Fibonacci retracement completes at 2.22. That area is also highlighted by the swing low from mid-December. If there is a rally above 2.01, higher targets become more likely of being tested.
For a look at all of today’s economic events, check out our economic calendar.