Natural Gas, WTI Oil, Brent Oil Forecasts – Oil Dives 5% As Traders Focus On Potential Ceasefire In Lebanon
Natural Gas
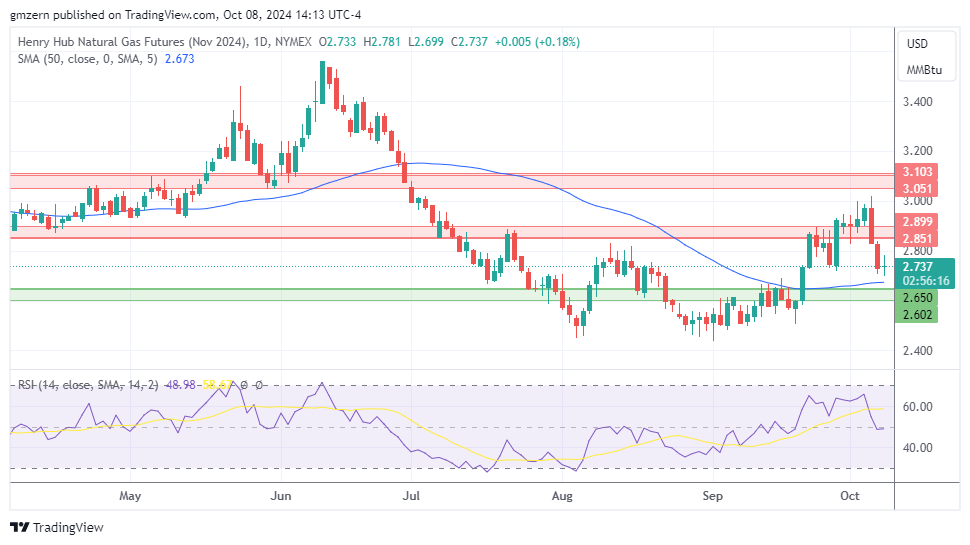
Natural gas prices stabilized after the recent pullback as traders waited for the impact of Hurricane Milton.
If natural gas declines below the $2.70 level, it will get to the test of the support at $2.60 – $2.65.
WTI Oil
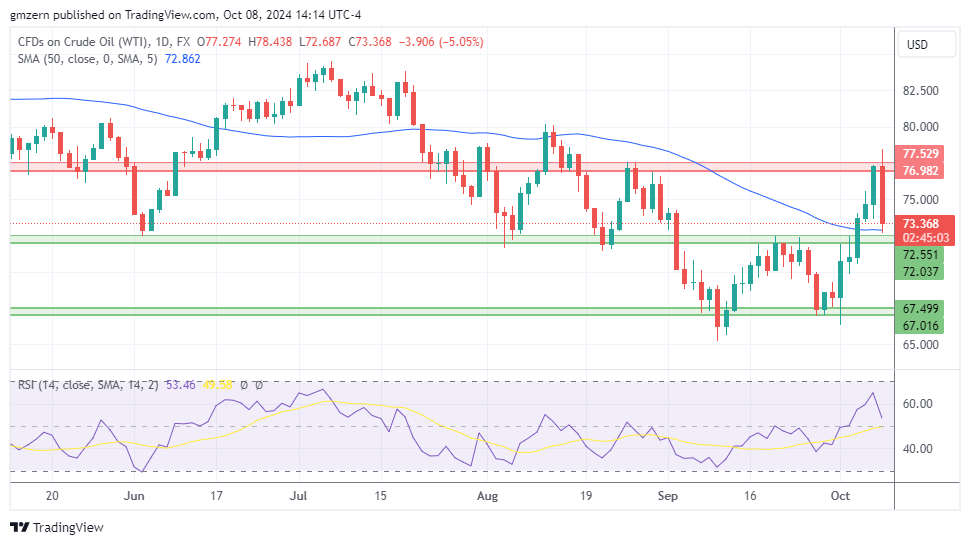
WTI oil is under strong pressure as traders cut their bets on a direct war between Israel and Iran. According to recent reports, Hezbollah is open for a ceasefire proposal, although it remains to be seen whether Israel is interested in any deal with the Iran-backed group.
A move below the support at $72.00 – $72.50 will push WTI oil towards the next support level at $67.00 – $67.50.
Brent Oil
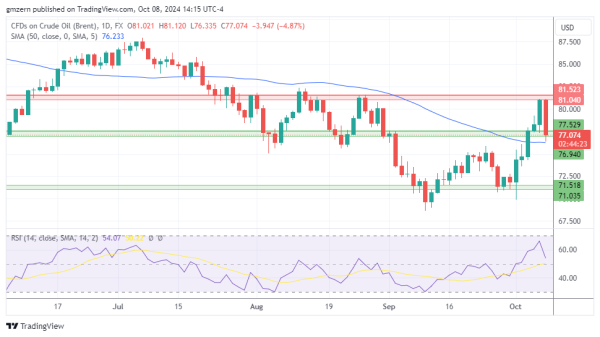
Brent oil is down by roughly 5% as traders evaluate the situation in the Middle East. At this point, it looks that Israel is focused on its operation against Hezbollah.
In case Brent oil declines below the $77.00 level, it will head towards the next support level, which is located in the $71.00 – $71.50 range.
For a look at all of today’s economic events, check out our economic calendar.