Natural Gas, WTI Oil, Brent Oil Forecasts – Oil Gains Ground As Middle East Tensions Rise
Natural Gas
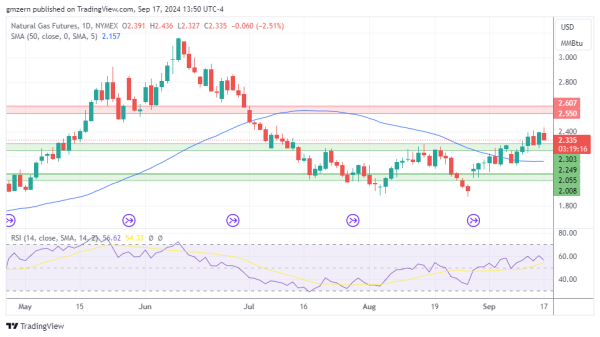
Natural gas pulls back as traders take some profits off the table near multi-month highs.
In case natural gas moves back below the support at $2.25 – $2.30, it will head towards the 50 MA at $2.15.
WTI Oil
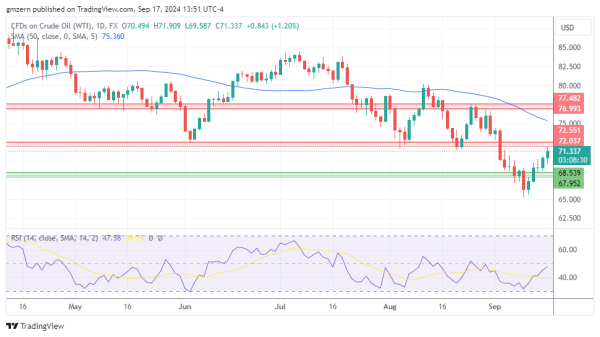
WTI oil tests new highs as traders focus on rising tensions in the Middle East. Thousands were hurt in mysterious pager blasts in Lebanon. The Iran-backed Hezbollah group accused Israel, and the market prepared for another round of escalation in the region.
A move above the resistance at $72.00 – $$72.50 will push WTI oil towards the next resistance at $77.00 – $77.50.
Brent Oil
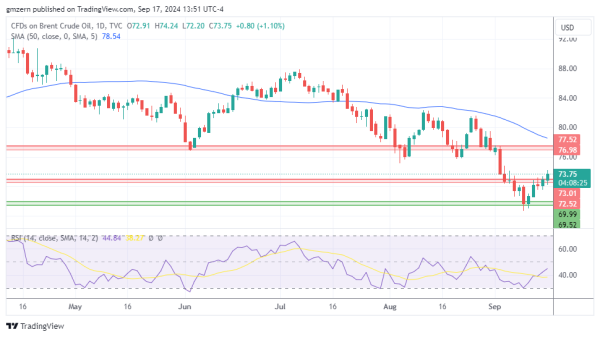
Brent oil gains ground amid broad rally in the oil markets, which is driven by rising tensions in the Middle East.
A successful test of the resistance at $72.50 – $73.00 opens the way to the test of the next resistance level at $77.00 – $77.50.
For a look at all of today’s economic events, check out our economic calendar.