Natural Gas, WTI Oil, Brent Oil Forecasts – Oil Gains Ground As Traders Focus On U.S. Economy
Natural Gas
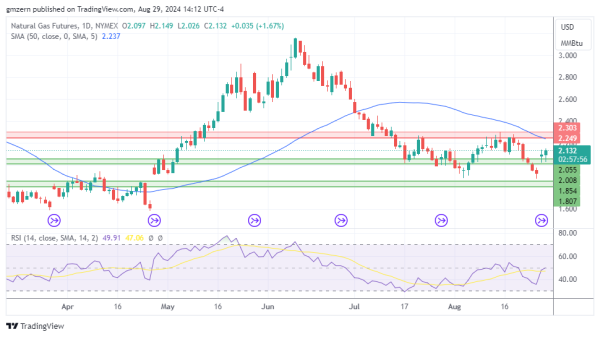
Natural gas gains ground as traders react to the EIA report, which indicated that working gas in storage increased by 35 Bcf from the previous week.
A move above the $2.15 level will push natural gas towards the resistance at $2.25 – $2.30.
WTI Oil
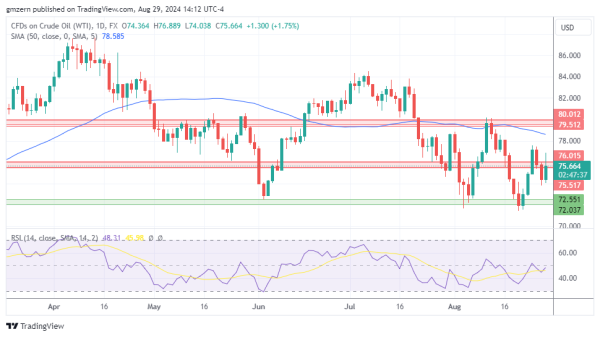
WTI oil gains ground as traders focus on the better-than-expected U.S. GDP Growth Rate report, which showed that the U.S. economy remained in good shape.
If WTI oil manages to settle above the resistance at $75.50 – $76.00, it will head towards the next resistance level at $79.50 – $80.00.
Brent Oil
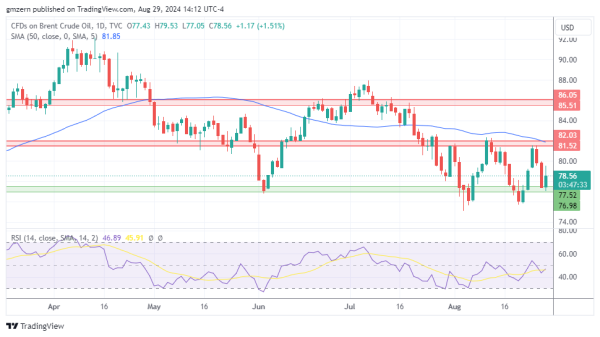
Brent oil moved higher amid broad rebound in the oil markets. From a big picture point of view, oil markets remain volatile as traders try to guess whether China’s demand would be sufficient to support prices in the upcoming months.
Brent oil needs to settle above the $80.00 level to gain additional upside momentum and move towards the resistance at $81.50 – $82.00.
For a look at all of today’s economic events, check out our economic calendar.