Natural Gas, WTI Oil, Brent Oil Forecasts – Oil Gains Ground On Production Disruptions In The GoM
Natural Gas
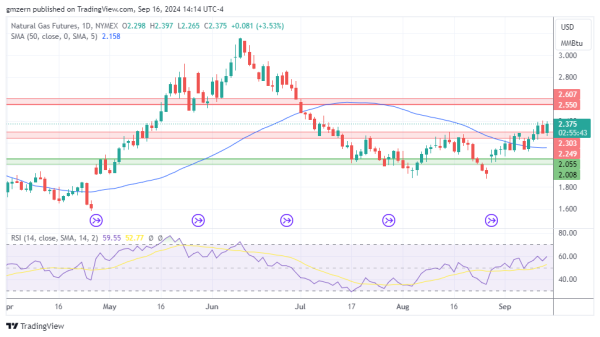
Natural gas gains ground as traders stay focused on supply disruptions. Weather forecasts are somewhat bearish, but natural gas managed to stay above the $2.30 level.
A move above the $2.40 level will push natural gas towards the resistance at $2.55 – $2.60.
WTI Oil
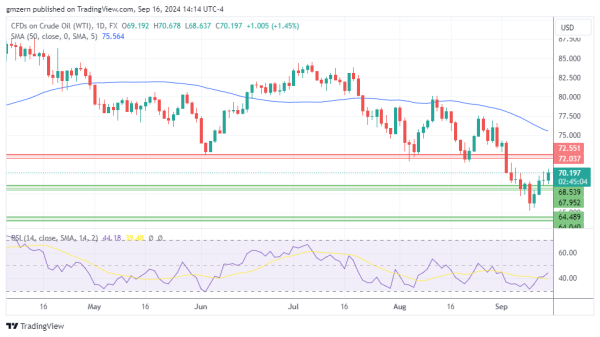
WTI oil is moving higher, supported by supply disruptions in the U.S. Gulf of Mexico after Hurricane Francine.
In case WTI oil manages to settle above the $70.00 level, it will move towards the resistance at $72.00 – $72.50.
Brent Oil
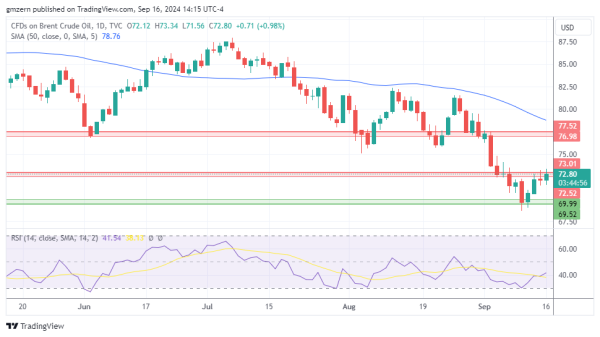
Brent oil continues its attempts to settle above the resistance at $72.50 – $73.00. According to recent reports, about 20% of GoM crude oil production remains offline, which is bullish for oil prices.
A move above the $73.00 level will open the way to the test of the next resistance at $77.00 – $77.50.
For a look at all of today’s economic events, check out our economic calendar.