Natural Gas, WTI Oil, Brent Oil Forecasts – Oil Pulls Back Ahead Of The Weekend
Natural Gas
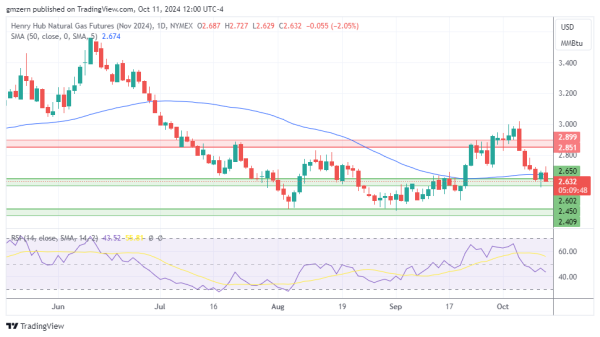
Natural gas remains under pressure as traders focus on the consequences of Hurricane Milton, which has led to lower demand.
A successful test of the support at $2.60 – $2.65 will push natural gas towards the next support level at $2.40 – $2.45.
WTI Oil
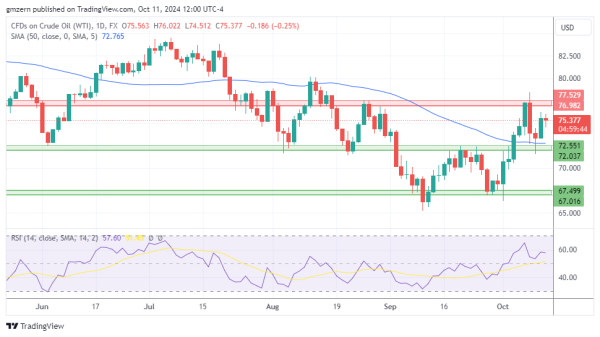
WTI oil is losing some ground as traders remain focused on the situation in the Middle East. Israel is expected to retaliate against Iran, and traders try to guess whether retaliation will impact Iran’s oil infrastructure.
A move above the $76.00 level will open the way to the test of the nearest resistance level at $77.00 – $77.50.
Brent Oil
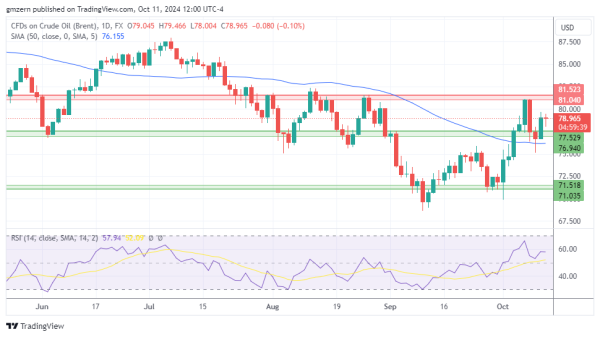
Brent oil moved lower in choppy trading. From a big picture point of view, traders are not ready for big moves ahead of the weekend.
Brent oil needs to settle above the $79.00 level to gain additional upside momentum in the near term.
For a look at all of today’s economic events, check out our economic calendar.