Natural Gas, WTI Oil, Brent Oil Forecasts – Oil Pulls Back As Crude Inventories Rise
Natural Gas
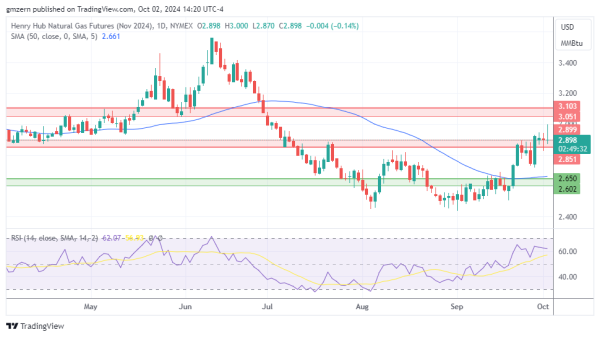
Natural gas made an attempt to settle above the $3.00 level but lost momentum and pulled back towards $2.90.
If natural gas settles below $2.85, it may gain additional downside momentum and move towards the nearest support at $2.60 – $2.65.
WTI Oil
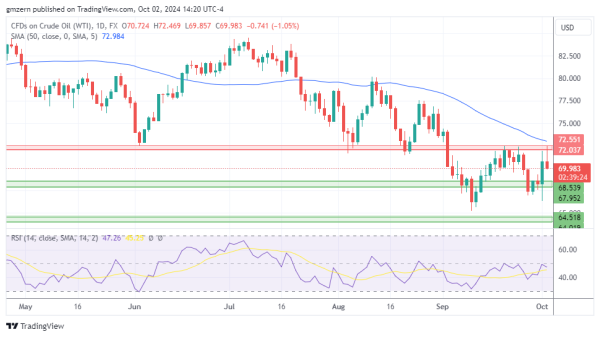
WTI oil retreats as traders focus on the EIA Weekly Petroleum Status Report, which indicated that crude inventories increased by 3.9 million barrels from the previous week.
A move below the $70.00 level will open the way to the test of the support at $68.00 – $68.50.
Brent Oil
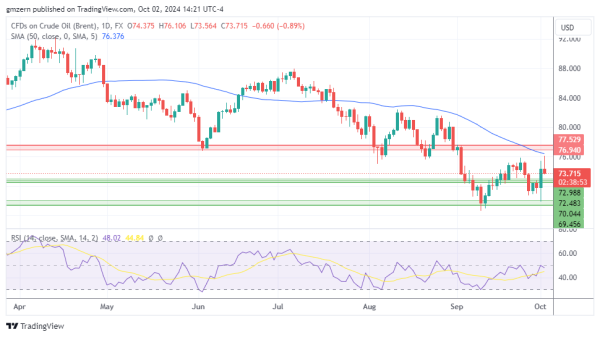
Brent oil pulled back as traders reacted to EIA data and focused on the developments in the Middle East.
A successful test of the nearest support level at $72.50 – $73.00 will open the way to the test of the next support at $69.50 – $70.00.
For a look at all of today’s economic events, check out our economic calendar.