Natural Gas, WTI Oil, Brent Oil Forecasts – Oil Pulls Back As Middle East Tensions Ease
Natural Gas
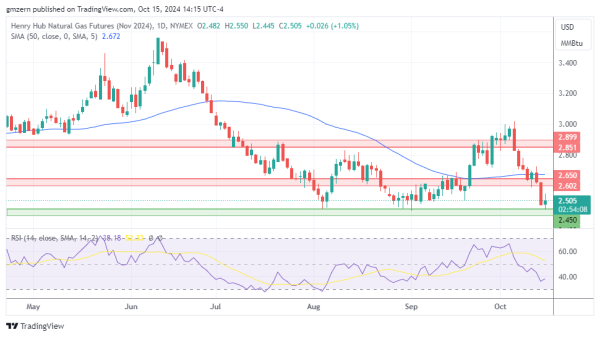
Natural gas is trying to rebound as traders take some profits off the table after the strong move.
If natural gas settles back above the $2.50 level, it will head towards the nearest resistance, which is located in the $2.60 – $2.65 range.
WTI Oil
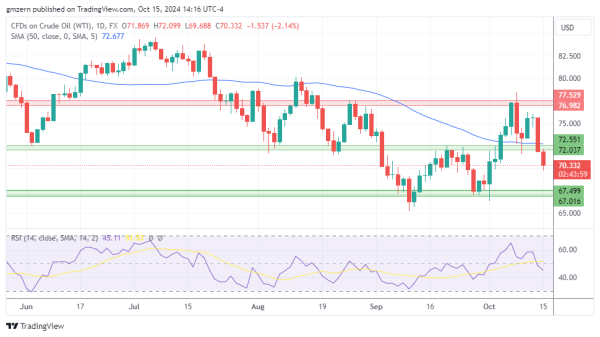
WTI oil remains under pressure amid reports indicating that Israel would not strike Iran’s oil infrastructure.
If WTI oil declines below the $70.00 level, it will head towards the next support level at $67.00 – $67.50.
Brent Oil
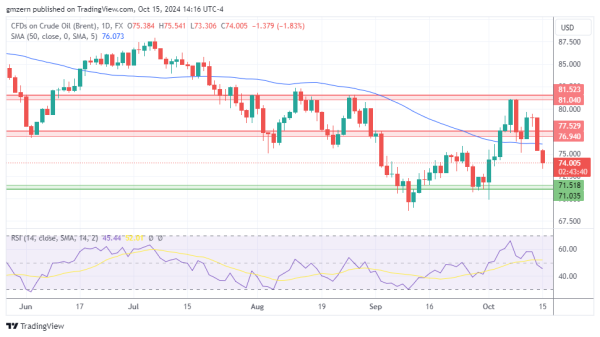
Brent oil is losing ground as traders focus on the developments in the Middle East and worry about the slowdown of China’s economy.
A move below the $73.50 level will open the way to the test of the support level at $71.00 – $71.50.
For a look at all of today’s economic events, check out our economic calendar.