Natural Gas, WTI Oil, Brent Oil Forecasts – Oil Pulls Back From Session Highs As Traders Focus On Middle East
Natural Gas
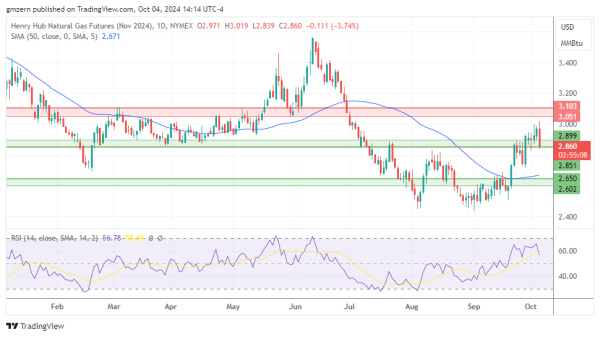
Natural gas pulls back as traders take profits near multi-month highs. Demand remains weak, which is bearish for natural gas prices.
If natural gas settles below the support at $2.85 – $2.90, it will head towards the next support level, which is located in the $2.60 – $2.65 range.
WTI Oil
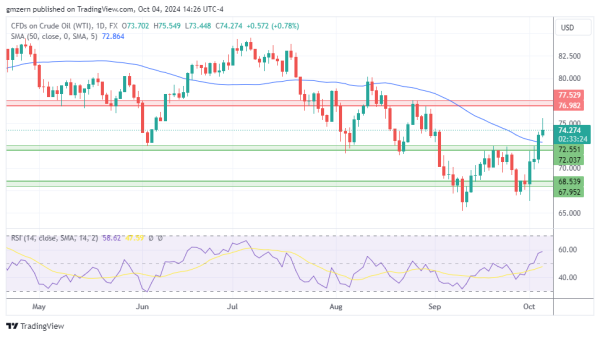
WTI oil moved away from session highs as traders took some profits off the table ahead of the weekend. The situation in the Middle East will remain the key driver for oil markets in the near term.
In case WTI oil settles back below the $74.00 level, it will head towards the nearest support, which is located in the $72.00 – $72.50 range.
Brent Oil
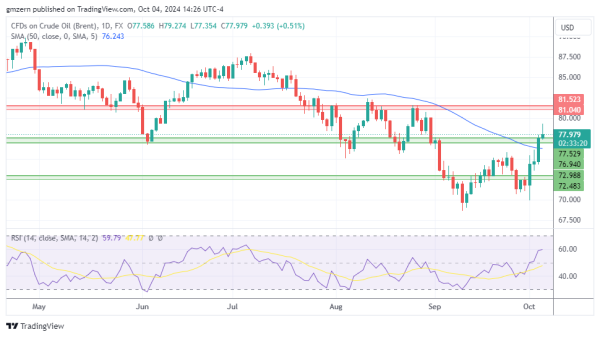
Brent oil has also pulled back from session highs. Traders are trying to guess whether Israel’s response on Iran’s attack will include strikes on oil facilities.
A move below the nearest support level at $77.00 – $77.50 will provide Brent oil with a chance to gain additional downside momentum.
For a look at all of today’s economic events, check out our economic calendar.