Natural Gas, WTI Oil, Brent Oil Forecasts – Oil Rallies As Israel Prepares To Retaliate Against Iran
Natural Gas
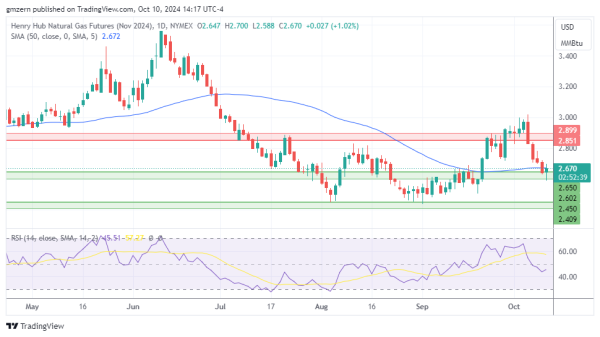
Natural gas rebounds from recent lows as traders focus on the EIA report, which indicated that working gas in storage increased by 82 Bcf from the previous week.
In case natural gas climbs above the $2.70 level, it will head towards the nearest resistance which is located in the $2.85 – $2.90 range.
WTI Oil
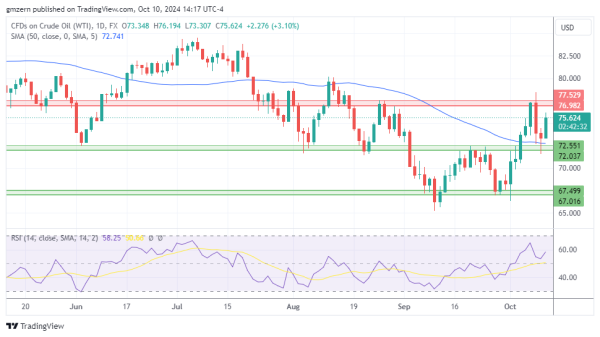
WTI oil rallied as traders waited for Israel’s retaliation against Iran. Recent reports indicate that Israel is close to the final decision on how it would respond to the recent attack from Iran.
From the technical point of view, WTI oil remains in a wide range between the support at $72.00 – $72.50 and the resistance at $77.00 – $77.50.
Brent Oil
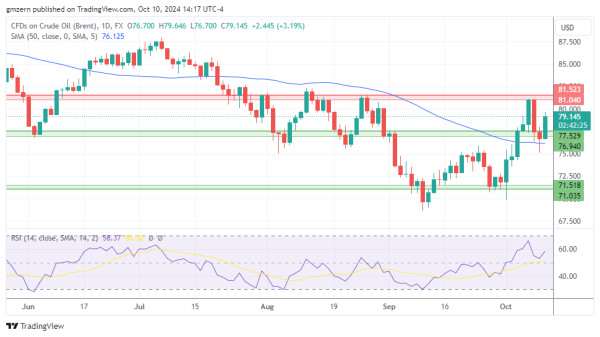
Brent oil gained strong upside momentum amid rising tensions in the Middle East. RSI is in the moderate territory, so there is plenty of room to gain additional upside momentum in the near term.
A move above the $80.00 level will push Brent oil towards the resistance at $81.00 – $81.50.
For a look at all of today’s economic events, check out our economic calendar.