Natural Gas, WTI Oil, Brent Oil Forecasts – Oil Rallies As OPEC+ Delays Production Hike
Natural Gas

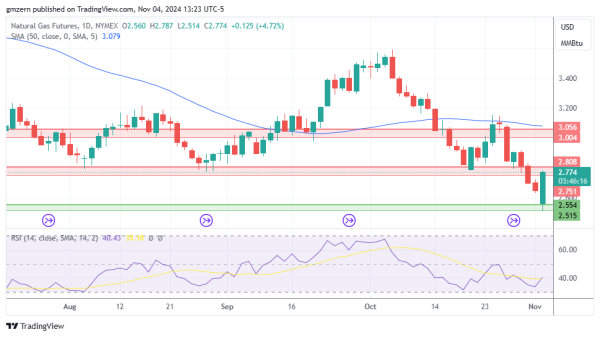
Natural gas rallied as traders rushed to buy the dip. It should be noted that demand is expected to be low this week, so it remains to be seen whether natural gas will gain additional momentum.
If natural gas manages to settle above the resistance at $2.75 – $2.80, it will head towards the next resistance level, which is located in the $3.00 – $3.05 range.
WTI Oil

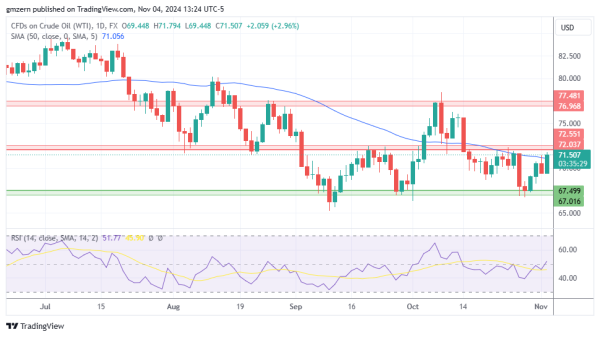
WTI oil gains ground as OPEC+ delayed its output hike. OPEC+ was due to increase output by 180,000 bpd in December.
In case WTI oil manages to settle above the resistance at $72.00 – $72.50, it will head towards the next resistance level at $77.00 – $77.50.
Brent Oil

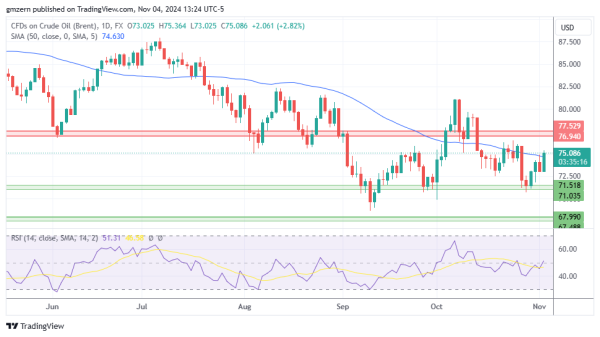
Brent oil is moving higher as traders focus on the news from OPEC+ and prepare for U.S. elections.
If Brent oil settles above the 50 MA at $74.62, it will move towards the resistance level, which is located in the $77.00 – $77.50 range.
For a look at all of today’s economic events, check out our economic calendar.