Natural Gas, WTI Oil, Brent Oil Forecasts – Oil Rallies As Traders Focus On Israel – Hezbollah Conflict
Natural Gas
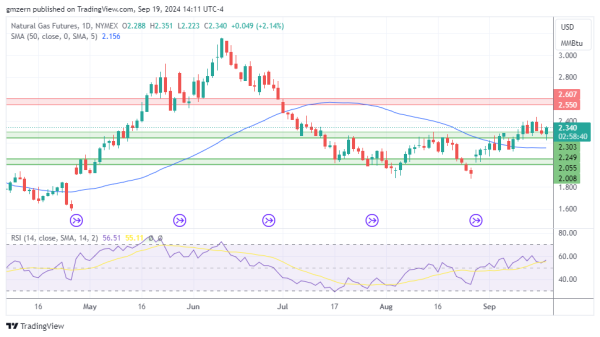
Natural gas gained ground as traders reacted to the EIA report, which indicated that working gas in storage increased by 58 Bcf from the previous week.
If natural gas manages to settle above the $2.40 level, it will head towards the resistance, which is located in the $2.55 – $2.60 range.
WTI Oil
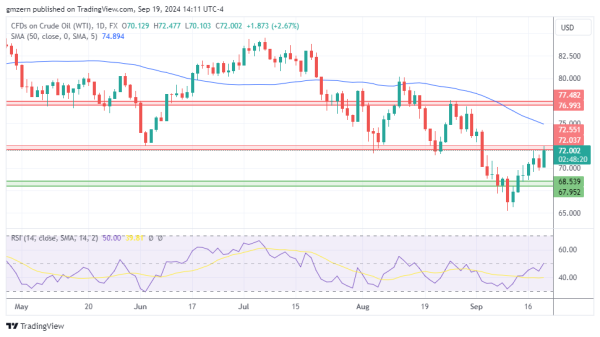
WTI oil tests resistance at $72.00 – $72.50 as traders focus on the situation in the Middle East and weigh the risks of a direct war between Israel and the Iran-backed Hezbollah.
A move above the $72.50 level will push WTI oil towards the next resistance level at $77.00 – $77.50.
Brent Oil
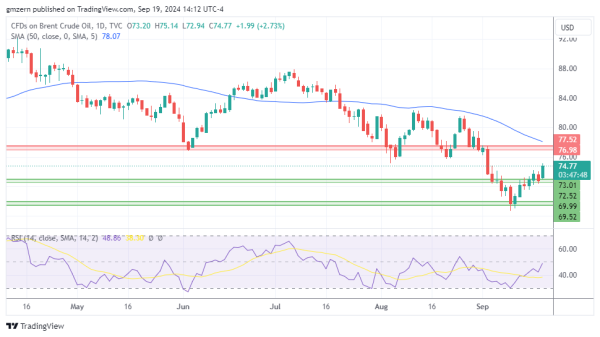
Brent oil tests new highs amid rising geopolitical tensions. From a big picture point of view, Brent oil continues to rebound from September lows.
If Brent oil climbs above $75.00, it will move towards the nearest resistance at $77.00 – $77.50.
For a look at all of today’s economic events, check out our economic calendar.