Natural Gas, WTI Oil, Brent Oil Forecasts – Oil Rebounds As Traders Focus On U.S. Economic Data
Natural Gas
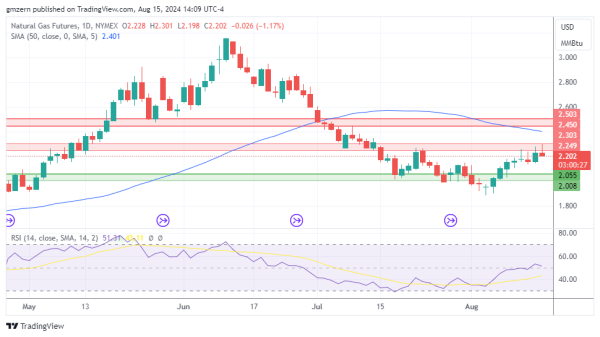
Natural gas pulls back despite the bullish EIA report, which indicated that working gas in storage declined by 6 Bcf from the previous week.
In case natural gas pulls back below the $2.15 level, it will head towards the nearest support at $2.00 – $2.05.
WTI Oil
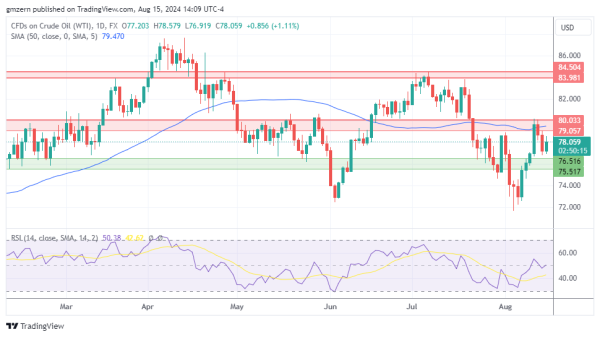
WTI oil rebounds after the recent sell-off. Traders react to the strong U.S. Retail Sales report, which showed that U.S. economy remained in a decent shape.
A move above the $78.00 level will push WTI oil towards the resistance at $79.00 – $80.00.
Brent Oil
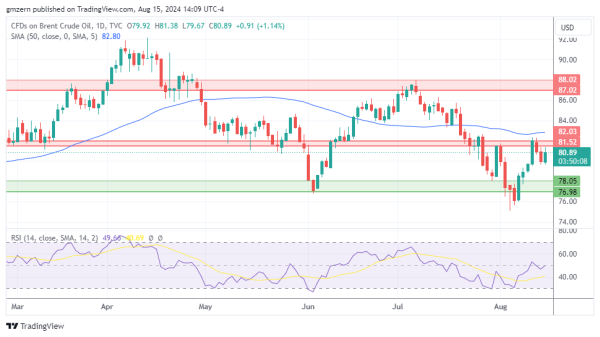
Brent oil gained ground as traders used the recent pullback as an opportunity to increase their long positions. Meanwhile, tensions in the Middle East continue to provide some support to oil markets.
From the technical point of view, Brent oil is moving towards the nearest resistance level at $81.50 – $82.00.
For a look at all of today’s economic events, check out our economic calendar.