Natural Gas, WTI Oil, Brent Oil Forecasts – Oil Rebounds From Session Lows As Gasoline Inventories Fall
Natural Gas
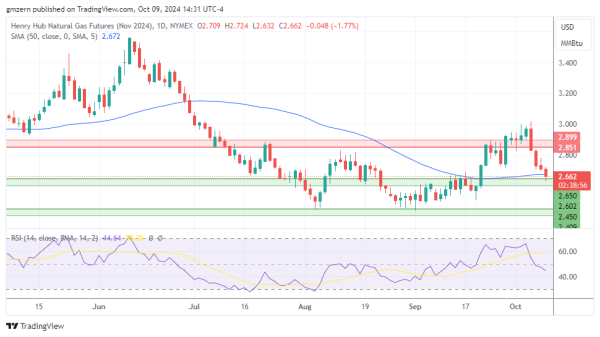
Natural gas tests new lows as traders prepare for the impact of Hurricane Milton, which may reduce demand for energy.
A move below the $2.60 level will push natural gas towards the next support level at $2.40 – $2.45.
WTI Oil
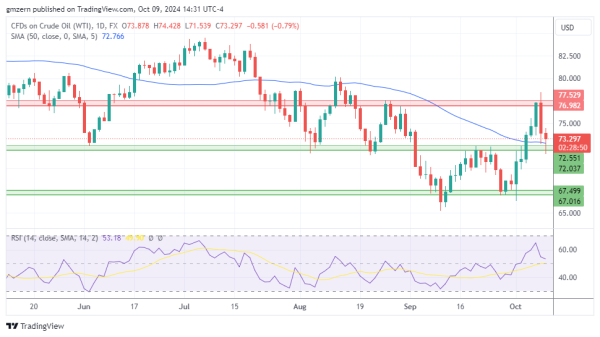
WTI oil rebounded from session lows as traders reacted to the EIA report, which showed that gasoline inventories declined by 6.3 million barrels from the previous week.
In case WTI oil settles back above the $74.00 level, it will head towards the next resistance level, which is located in the $77.00 – $77.50 range.
Brent Oil
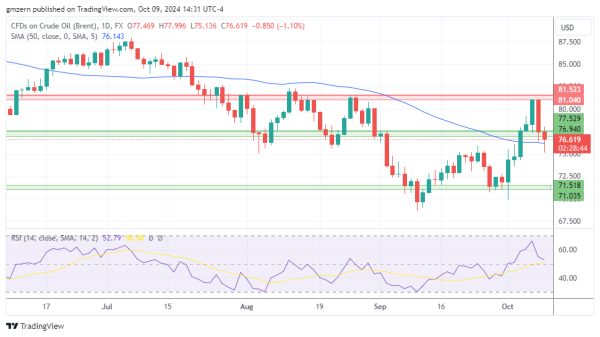
Brent oil has also moved away from session lows as traders reacted to EIA data and remained focused on the developments in the Middle East.
A move above the $77.50 level will push Brent oil towards the psychologically important $80.00 level.
For a look at all of today’s economic events, check out our economic calendar.