Natural Gas, WTI Oil, Brent Oil Forecasts – Oil Remains Under Pressure As Middle East Tensions Ease
Natural Gas
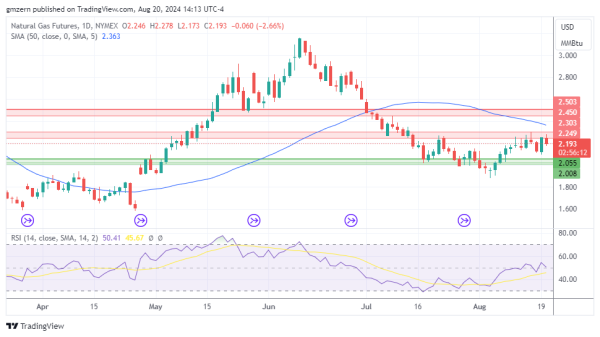
Natural gas is losing ground after an unsuccessful attempt to settle above the resistance at $2.25 – $2.30.
The technical picture remains unchanged as natural gas needs to climb above the $2.30 level to gain additional upside momentum.
WTI Oil
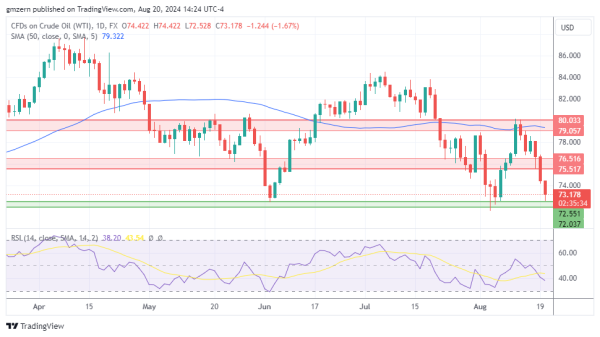
WTI oil tested new lows amid reports indicating that Gaza ceasefire negotiations were progressing well.
It should be noted that WTI oil received support near the $72.50 level and moved away from session lows. A move above $74.00 will push WTI oil towards the resistance at $75.50 – $76.50.
Brent Oil
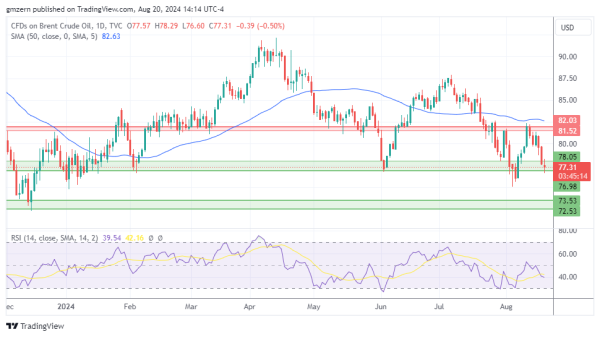
Brent oil remains under pressure as traders fear that China’s demand for oil would not be as strong as previously expected.
A successful test of the support at $77.00 – $78.00 will push Brent oil towards the next support level at $72.50 – $73.50.
For a look at all of today’s economic events, check out our economic calendar.