Natural Gas, WTI Oil, Brent Oil Forecasts – Oil Retreats On Profit-Taking
Natural Gas
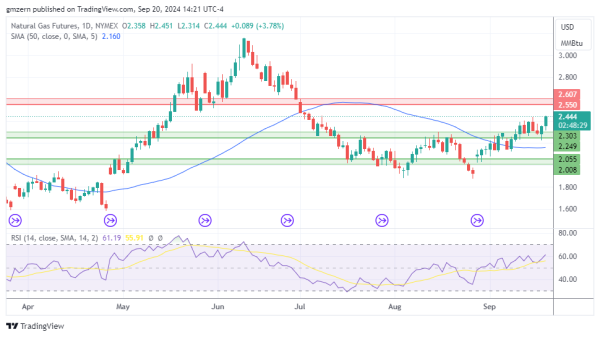
Natural gas managed to climb above the $2.40 level and gained additional upside momentum.
A move above $2.45 will push natural gas towards the nearest resistance, which is located in the $2.55 – $2.60 range.
WTI Oil
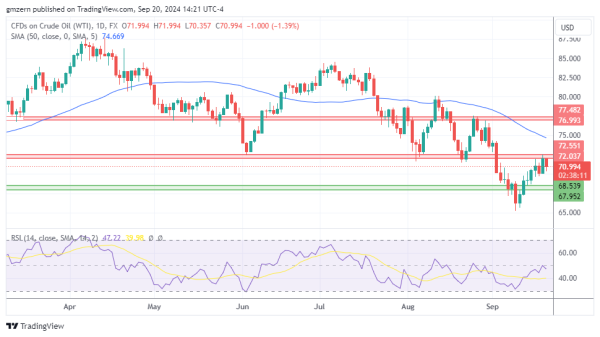
WTI oil pulls back despite rising tensions in the Middle East. Traders take some profits off the table after the strong rebound from September lows.
A move below the $70.00 level will push WTI oil towards the support at $68.00 – $68.50.
Brent Oil
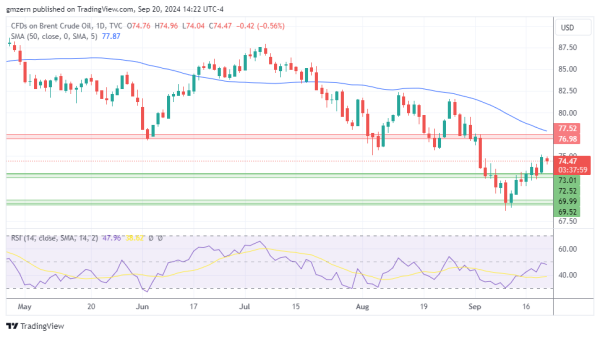
Brent oil has also moved lower amid broad pullback in the oil markets. Traders reduced their exposure to oil ahead of the weekend.
From the technical point of view, Brent oil needs to settle above the $75.00 level to gain additional upside momentum.
For a look at all of today’s economic events, check out our economic calendar.