Natural Gas, WTI Oil, Brent Oil Forecasts – Oil Tests New Highs Amid Rising Tensions In The Middle East
Natural Gas

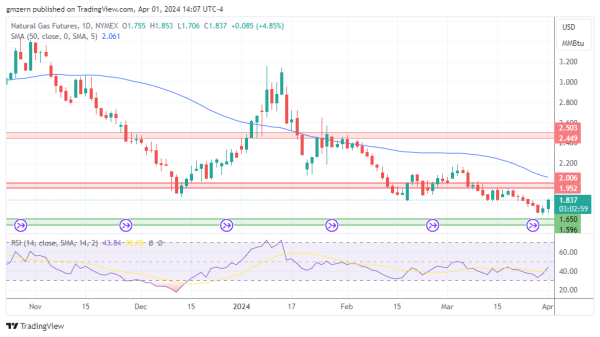
Natural gas is moving higher as traders bet that it would not be able to settle below the key support at $1.60 – $1.65.
If natural gas stays above the $1.80 level, it will head towards the resistance at $1.95 – $2.00.
WTI Oil

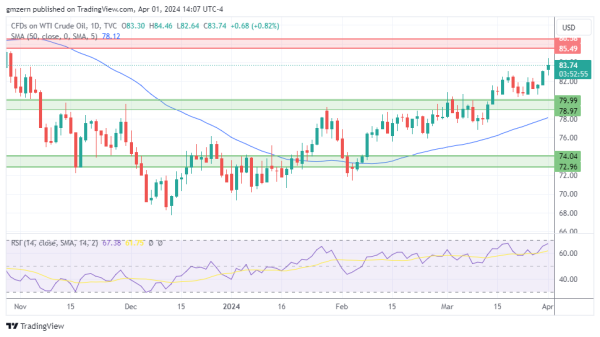
WTI oil gains ground amid rising tensions in the Middle East. Iran’s consulate in Syria was destroyed by an air strike, raising worries about an escalation of tensions between Iran and Israel.
A move above the $84.50 level will push WTI oil towards the next resistance level, which is located in the $85.50 – $86.50 range.
Brent Oil

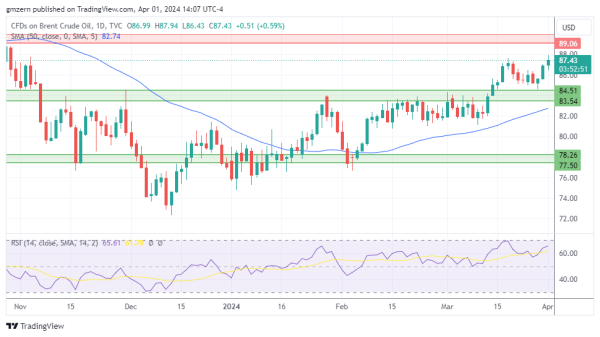
Brent oil tested new highs as traders focused on tight supply, healthy demand, and geopolitical risks.
The technical picture is bullish as Brent oil managed to test new highs after a period of consolidation.
For a look at all of today’s economic events, check out our economic calendar.