Natural Gas, WTI Oil, Brent Oil Forecasts – Oil Tests New Highs As Traders Focus On Middle East War Risk
Natural Gas
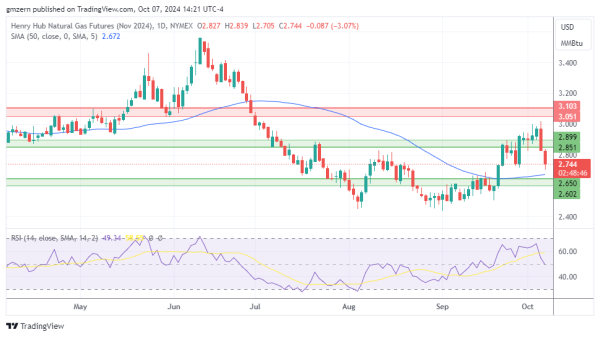
Natural gas is losing ground as traders focus on Hurricane Milton, which may hurt demand for energy.
From the technical point of view, natural gas settled below the support at $2.85 – $2.90 and is moving towards the next support level at $2.60 – $2.65.
WTI Oil
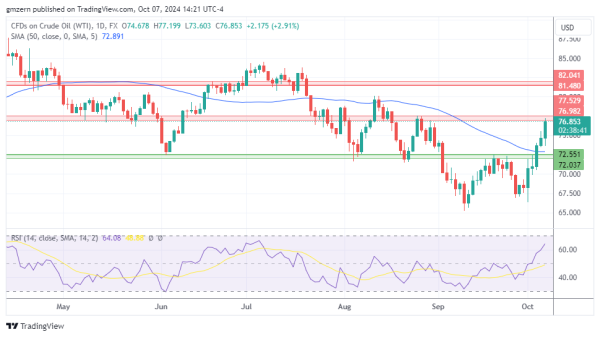
WTI oil tests new highs as traders remain focused on the situation in the Middle East. It looks that short-covering has served as a significant catalyst for the rally.
A successful test of the resistance at $81.00 – $81.50 will open the way to the test of the next resistance level at $85.50 – $86.00.
Brent Oil
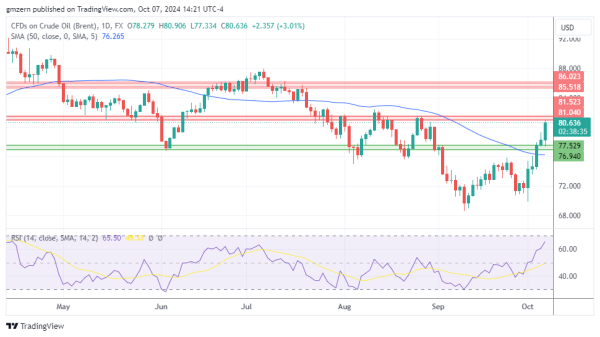
Brent oil rallied above $80.00 as traders evaluated the chances of a major war in the Middle East.
A move above the $81.50 level will push Brent oil towards the resistance at $85.50 – $86.00.
For a look at all of today’s economic events, check out our economic calendar.