Natural Gas, WTI Oil, Brent Oil Forecasts – Oil Tests New Highs As Traders Stay Focused On The Middle East
Natural Gas
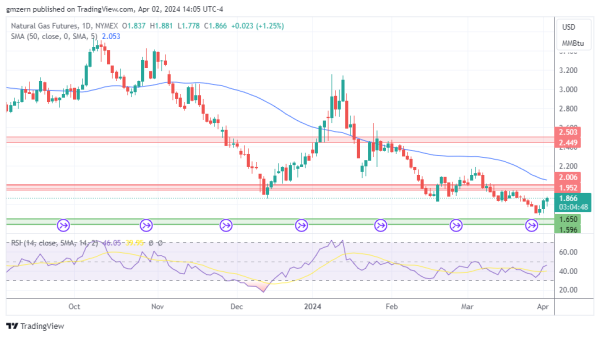
Natural gas is moving higher as the rebound continues. Colder weather forecasts provide support to natural gas markets.
From the technical point of view, natural gas is moving towards the nearest resistance level at $1.95 – $2.00.
WTI Oil
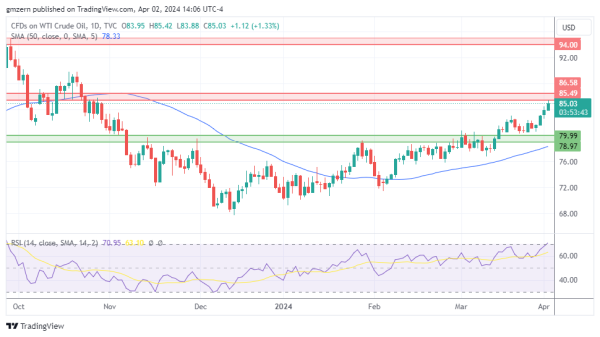
WTI oil tests new highs as traders stay focused on rising tensions in the Middle East. According to recent reports, Saudi Arabia may raise oil prices for Asian customers, which is bullish for oil markets.
In case WTI oil settles above the resistance at $85.50 – $86.50, it will move towards the next significant resistance level, which is located in the $94.00 – $95.00 range.
Brent Oil
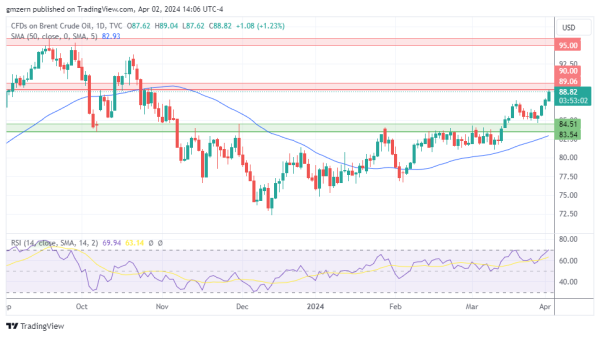
Brent oil tested the $89.00 level amid a broad rally in the oil markets. The recent developments in the Middle East have raised the risk premium for oil prices.
A move above the resistance at $89.00 – $90.00 will push Brent oil towards the next resistance level at $95.00 – $96.00.
For a look at all of today’s economic events, check out our economic calendar.