Natural Gas, WTI Oil, Brent Oil Forecasts – Oil Tests New Lows On Demand Worries
Natural Gas
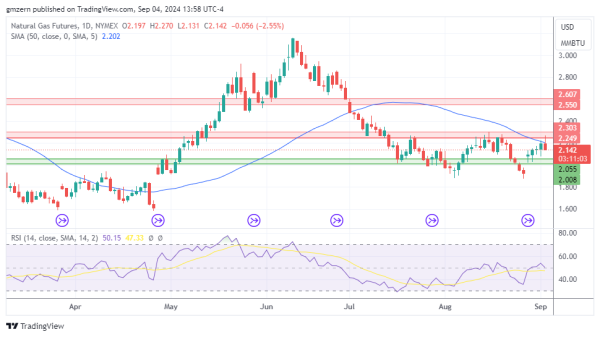
Natural gas is losing ground as traders take profits off the table after the recent rebound.
In case natural gas settles back below the $2.15 level, it will head towards the support at $2.00 – $2.05.
WTI Oil
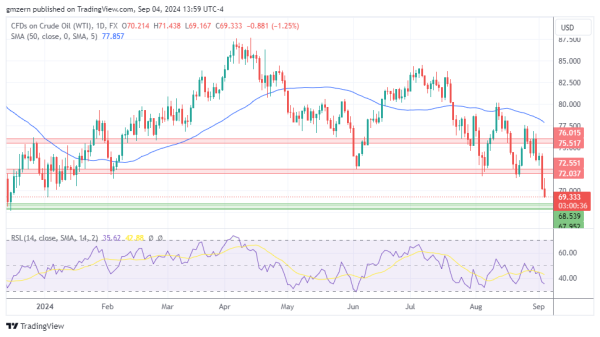
WTI oil tests new lows as traders focus on the weaker-than-expected JOLTs Job Openings report, which showed that U.S. economy was slowing down.
A move below the $69.00 level will push WTI oil towards the nearest support at $68.00 – $68.50.
Brent Oil
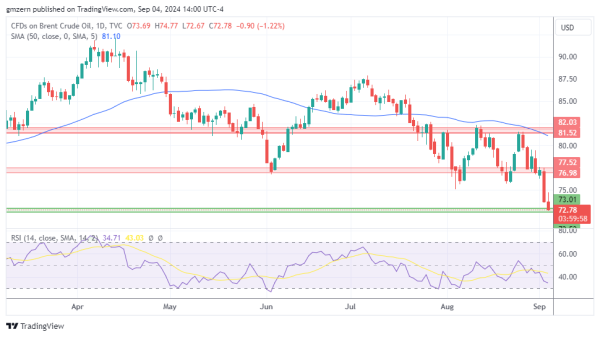
Brent oil remains under pressure amid demand worries. Recent reports indicated that OPEC+ may delay its planned production increase. However, these reports did not provide sustainable support to the market as traders remained focused on economic data.
Currently, Brent oil is trying to settle below the support at $72.50 – $73.00. A move below $72.50 will open the way to the test of the $70.00 level.
For a look at all of today’s economic events, check out our economic calendar.