Natural Gas, WTI Oil, Brent Oil Forecasts – Oil Tests Weekly Lows Amid Demand Concerns
Natural Gas
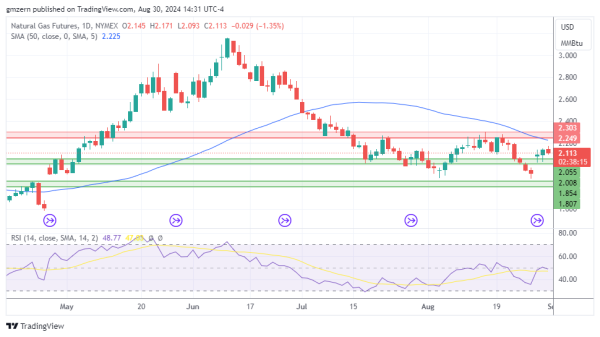
Natural gas is losing some ground as traders stay cautious due to oversupply. From a big picture point of view, natural gas markets need significant positive catalysts to gain sustainable upside momentum.
In case natural gas manages to settle above the $2.15 level, it will move towards the resistance at $2.25 – $2.30.
WTI Oil
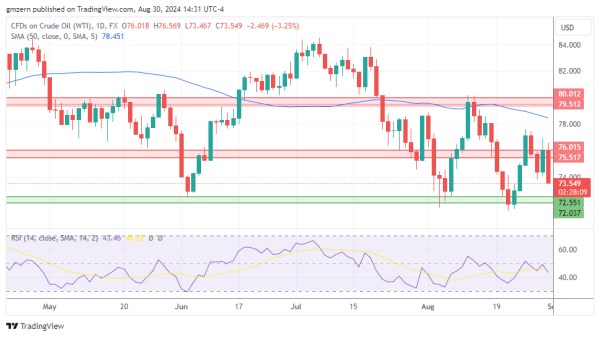
WTI oil tests new lows as traders shrug off worries about Libya’s production shutdown and focus on China’s economic problems.
A move below the $73.00 level will push WTI oil towards the nearest support at $72.00 – $72.50.
Brent Oil
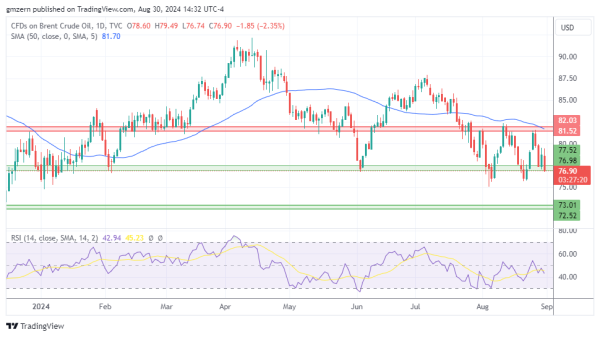
Brent oil is losing ground amid broad pullback in the oil markets. Stronger dollar put additional pressure on commodity markets today.
A successful test of the support at $77.00 – $77.50 will open the way to the test of the next support level at $72.50 – $73.00.
For a look at all of today’s economic events, check out our economic calendar.