Natural Gas, WTI Oil, Brent Oil Forecasts – WTI Oil Gains 2.5% As Francine Disrupts Production In GoM
Natural Gas
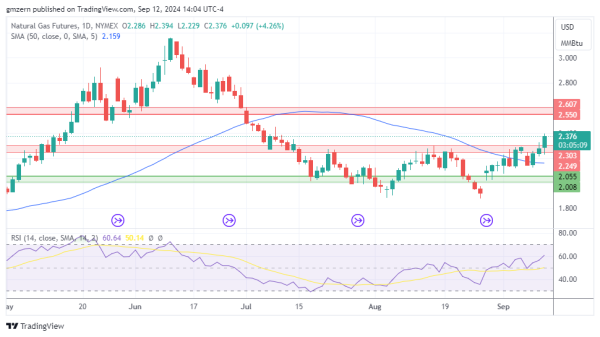
Natural gas tests new highs as traders react to the EIA report, which indicated that working gas in storage increased by 40 Bcf, compared to analyst consensus of +49 Bcf.
If natural gas stays above the $2.30 level, it will move towards the resistance at $2.55- $2.60.
WTI Oil
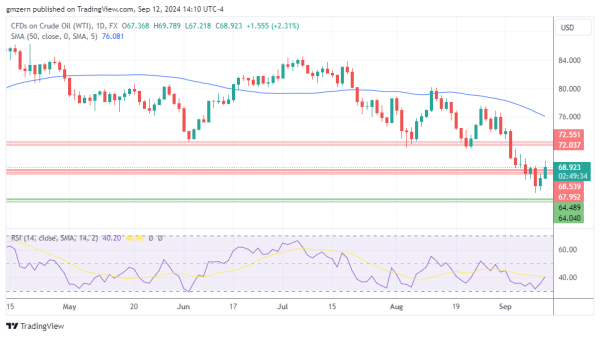
WTI oil gained ground as traders focused on the impact of Hurricane Francine. According to UBS, about 1.5 million barrels of Gulf of Mexico production was shut by the storm.
If WTI oil settles above the resistance at $68.00 – $68.50, it will move towards the next resistance level at $72.00 – $72.50.
Brent Oil
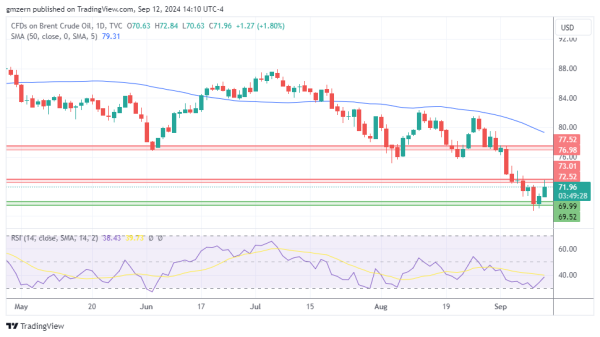
Brent oil gained ground as raders focused on the situation in the U.S. Gulf of Mexico.
A successful test of the resistance at $72.50 – $73.00 will push Brent oil towards the next resistance level, which is located in the $77.00 – $77.50 range.
For a look at all of today’s economic events, check out our economic calendar.