Oil and Natural Gas Technical Analysis Amid Cooling Geopolitical Tensions
WTI oil (CL) and Brent oil (BCO) dropped on Monday due to bearish solid price developments. Israel launched airstrikes against Iran, which, according to Iran, caused limited damage. Israel has not targeted Iran’s oil facilities, easing the likelihood of an immediate escalation that might impact oil supplies. This reduction in geopolitical tensions has shifted the market focus back to oil demand.
OPEC+ has postponed its planned output increase from October to December. According to the plan, OPEC+ will increase production by 180,000 barrels per day in December 2024 and another 216,000 by January 2025. Crude oil prices have resumed a downward trend, forming bearish technical patterns. Chinese demand trends further reinforce the technical patterns, which support this bearish price development. China’s imports have lagged by 350,000 barrels per day this year, with cautious stockpiling and variable import trends tempering global demand forecasts. Additionally, the global shift towards electric vehicles impacts long-term oil demand, creating uncertainty in the oil market.
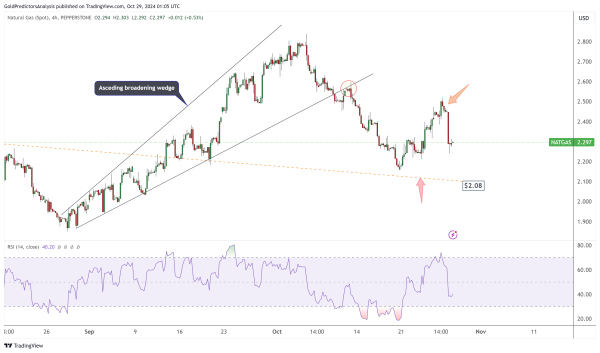
On the other hand, natural gas (NG) prices have also decreased due to reduced demand from warmer temperatures across the U.S. In the Northeast, rising temperatures led to fewer heating degree days, while in the Southeast, stable temperatures resulted in fewer cooling needs. Natural gas prices rebounded from strong support but dropped again from $2.48.
WTI Oil (CL) Technical Analysis
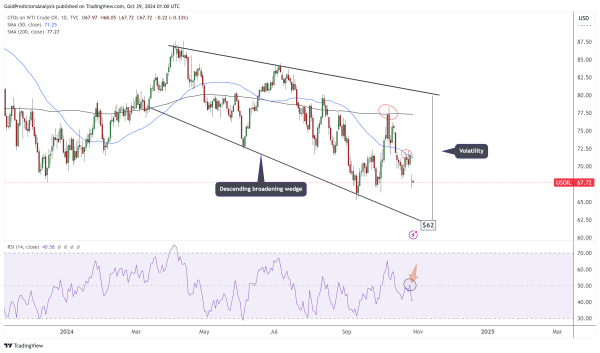
WTI Daily Chart – Descending Broadening Wedge
WTI crude oil opened with a gap on Monday and continued to decline. The price trades within a descending broadening wedge pattern, indicating strong volatility. It is below the 50-day and 200-day SMAs, with the Monday gap suggesting significant bearish pressure in the oil market. Additionally, the RSI is reversing lower from the mid-level, highlighting bearish momentum. The daily chart shows that WTI crude oil targets the $62-$63 level. This level of support is measured using the descending broadening wedge line.
The emergence of a broadening wedge pattern highlights market volatility, indicating the potential for significant price moves in both directions. While geopolitical tensions may be easing in the short term, the underlying issues remain unresolved. Therefore, any potential event may further create price fluctuations, keeping strong price ranges in both directions as the primary scenario for the oil market.
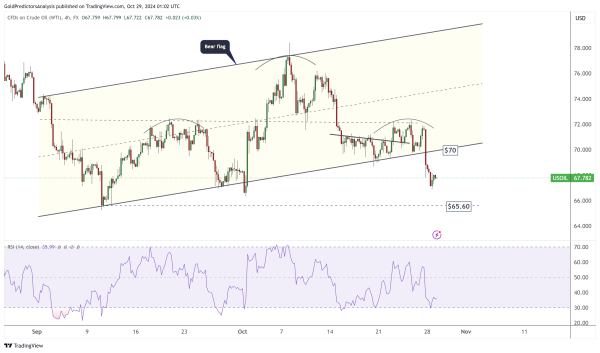
WTI 4-Hour Chart – Bear Flag
The 4-hour chart also shows that WTI crude oil has broken out of a bear flag pattern, signalling the potential for further declines. However, the price is trading within strong ranges, as indicated by the descending broadening wedge pattern on the daily chart. These patterns suggest the possibility of strong price movements in both directions. Additionally, the 4-hour chart shows a potential head-and-shoulders formation, which would be triggered if WTI crude oil breaks below $65.60.
Brent Oil (BCO) Technical Analysis
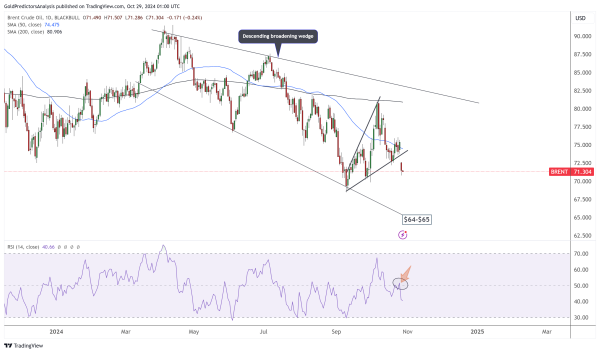
Brent Daily – Descending Broadening Wedge Pattern
Brent oil also forms a descending broadening wedge pattern, with a target of $64-$65 on the daily chart. The price is trading below the mid-level of the RSI, which increases bearish pressure and the likelihood of continued downward momentum.
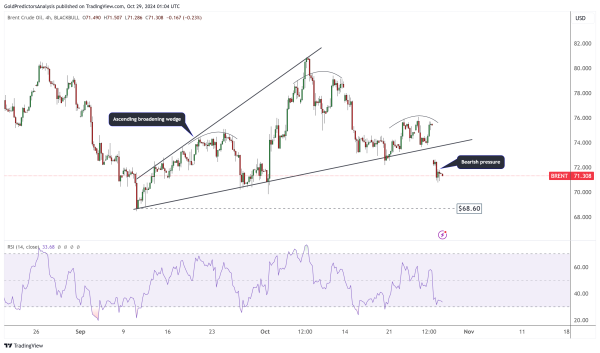
Brent 4-Hour Chart – Ascending Broadening Wedge Pattern
The 4-hour chart for Brent oil shows the formation of an ascending broadening wedge pattern. The recent decline in Brent oil, driven by weaker demand, has broken this wedge pattern, and the price is currently falling. The support level for this pattern is $68.60. The price is likely moving toward this support level as the ascending broadening wedge has been broken.
Natural Gas (NG) Technical Analysis
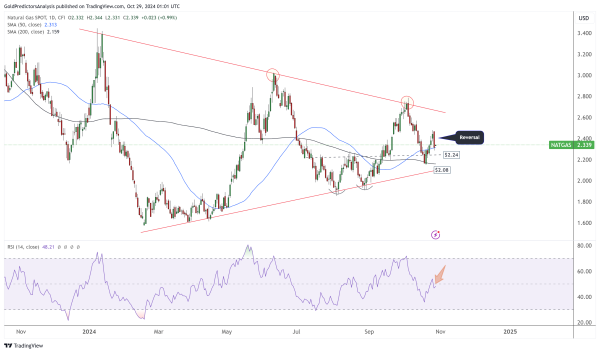
Natural Gas Daily – Triangle Pattern
Natural gas prices are consolidating within a triangle pattern on the daily chart. The price rebounded higher last week from strong support but reversed lower on Monday’s opening. Weaker demand and market uncertainty contribute to bearish momentum for natural gas prices. Strong support levels for natural gas are at $2.24 and $2.08. A break below $2.08 would increase market pressure and continue the downward momentum.
Natural Gas 4-Hour Chart – Bearish Trend
The 4-hour chart for natural gas also shows bearish momentum. The rebound from support at $2.24 has ended, and the price is shifting focus to the downside. The RSI indicates that the recent rebound took it above overbought levels. The short-term price action suggests further downside momentum in natural gas prices.
