Overview of the EUR/USD pair. April 2nd. ECB may cut rates in 2024 twice as much as the Fed
The EUR/USD currency pair traded with low volatility and a slight downward trend for most of Monday. The most significant event on Monday was the ISM Manufacturing Purchasing Managers' Index in the United States, which was released later in the day, but it evidently had no impact on the pair's movement throughout the day. From our perspective, there was another, much more significant event on Monday, though it was initially challenging to discern. But first, a brief backstory.
We remind traders that there is a global shift in market expectations occurring. Market participants who were anticipating the first rate cut from the Fed in March did not see it materialize. Furthermore, Jerome Powell's unequivocal hints on Friday suggested that even in June, the rate may remain unchanged. This is due to American inflation, which has mostly stayed the same over the last 9 months. We have repeatedly mentioned that the market expects too much from the Fed. We have said that the rate will only start to decline when inflation drops to at least 2.5%. If inflation consistently remains above 3%, then what discussion of monetary policy easing can there be? Setting timelines in this matter is simply meaningless. The Fed has no set timeline for when easing is supposed to begin. It all depends on inflation.
In parallel with the theme of "when will the Fed cut rates," there is the question of "how many times will the Fed cut rates in 2024." Recall that at the beginning of the year, the market expected 6-7 cuts from the American regulator. Raphael Bostic says that only one policy easing is possible, while most experts believe that two or three rounds of easing will be carried out. Once again, the market's expectation from the Fed was too high.
As a result, the Fed's "hawkish" policy will persist longer than expected, which should practically leave no room for the dollar's strengthening. And what about the ECB? On Monday, one of the ECB board members, Yannis Stournaras, stated that this year, there could be four stages of rate cuts by 0.25%. Thus, the rate could decrease by a total of 1%, while in the US, as a reminder, it could decrease by 0.50%. The ECB will carry out more easing in 2024 than the Fed. And this factor should only exert additional pressure on the European currency.
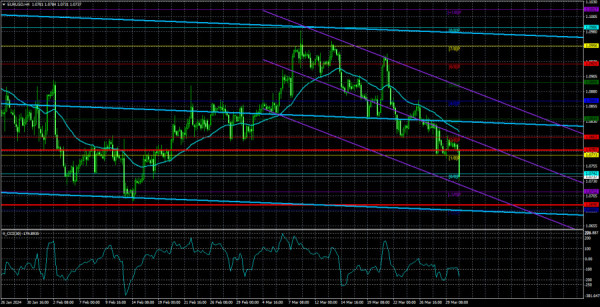
Therefore, as before, we expect only declines in the EUR/USD pair. The ECB may cut rates more times than the market expected, while the Fed may cut rates much fewer times. What else is needed for the euro to decline? We still expect declines towards parity. The euro currently has no grounds for growth, and since it is not the pound, which ignores any fundamental background in favor of the dollar, the decline should continue. From a technical point of view, nothing changes. The pair remains below the moving average line. There are no signals for an upward reversal.
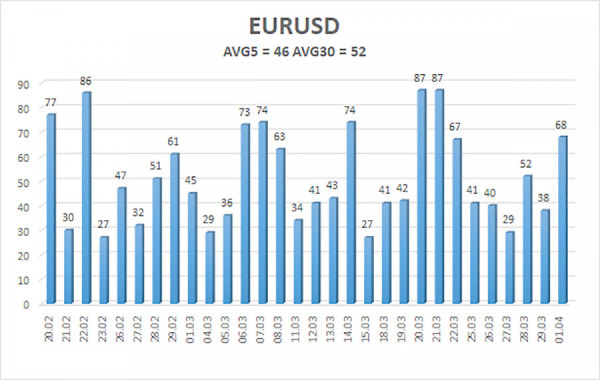
The average volatility of the euro/dollar currency pair over the last 5 trading days as of April 2nd is 46 points and is characterized as "low." This week, volatility may increase due to a large number of important publications in the US and the EU. We expect the pair to move between the levels of 1.0690 and 1.0782 on Tuesday. The senior linear regression channel is still downward, maintaining the overall downward trend. The CCI indicator has again entered the oversold zone, but we do not expect a strong rise in the pair within the downward trend.
Nearest support levels:
S1 - 1.0742
S2 - 1.0712
S3 - 1.0681
Nearest resistance levels:
R1 - 1.0773
R2 - 1.0803
R3 - 1.0834
Trading recommendations:
The EUR/USD pair continues to remain below the moving average line. Thus, it is possible to maintain short positions with targets at 1.0712 and 1.0690. We expect a decline towards the 7th level, and in the longer term, towards the level of 1.0200. After a fairly long rise in the pair (which we consider a correction), we see no grounds for considering long positions. Even if the price consolidates above the moving average. The first day of the week showed decent volatility, so further movements will not be worse.
Explanations for illustrations:
Linear regression channels - help determine the current trend. If both are directed in the same direction, it means the trend is currently strong.
The moving average line (settings 20.0, smoothed) - determines the short-term trend and the direction in which trading should be conducted.
Murray levels - target levels for movements and corrections.
Volatility levels (red lines) - the probable price channel in which the pair will spend the next day, based on current volatility indicators.
CCI indicator - its entry into the oversold zone (below -250) or overbought zone (above +250) indicates an approaching trend reversal in the opposite direction.