Overview of the GBP/USD pair. April 2nd. The British pound continues to ignore the fundamental background
The GBP/USD currency pair on Monday continued to pretend to trade until the release of the ISM index. Inexperienced traders may think that a downward trend has formed in the 4-hour timeframe, but we want to note that this is not the case. First, switch to the 24-hour chart, and it becomes clear that the market has been flat for 4 months. Second, the trading terminal tends to adjust to the strength of movements and scale the pair's movement chart. In other words, if the movements are very weak, it increases the scale, so it may seem that the movements are not that weak. However, the chart below clearly shows that the volatility is "zero," and nothing changed on Monday.
It is also not worth popping champagne over the fact that the pound remains below the moving average line. As we have already mentioned, the market has been flat on practically all timeframes. Even on the smallest ones, because last week, the price moved exclusively sideways. Thus, even if we see a trending movement within a single day in the near future, it will not mean anything. The pound needs to address the global flat issue. More precisely, the market needs to address it. Until this happens, we evaluate the GBP/USD pair as unfavorable for trading.
One should remember another significant factor. The market very often needs to pay more attention to its fundamental and macroeconomic background. Especially the one that favors the US currency. Let's be frank, over the 4 months of flat, there have been enough central bank meetings, important reports, and speeches. And all these events did not prompt the market to trade differently. Therefore, even if this week's data on non-farms, unemployment, and ISM business activity indices turn out to be significantly stronger than forecasts, this absolutely does not guarantee a dollar's rise. However, if they turn out to be weaker than forecasts, there is no doubt that the dollar will plummet.
Why such a situation arises with the pound is quite difficult to say. The thing is, even the COT reports tell us about an increase in pound sales by large market players. But even in this case, the pound does not fall. There is a feeling that, behind the scenes, the Bank of England rules the ball, secretly conducting currency interventions to prevent a new decline in the British currency. Recall that over the past 16 years, the pound has mainly depreciated against the dollar. Since 2016, this decline has raised absolutely no questions. Brexit, the pandemic, the arrival of Liz Truss, the economic downturn due to Brexit, and the not-so-favorable deal with the EU all put pressure on the economy and the pound. Therefore, the British currency should be falling even now because we have not received any positive news from Albion for a very long time.
There will be quite a lot of important events this week, so we can count on at least an increase in volatility, which will allow trading the pair on smaller timeframes and expecting profit.
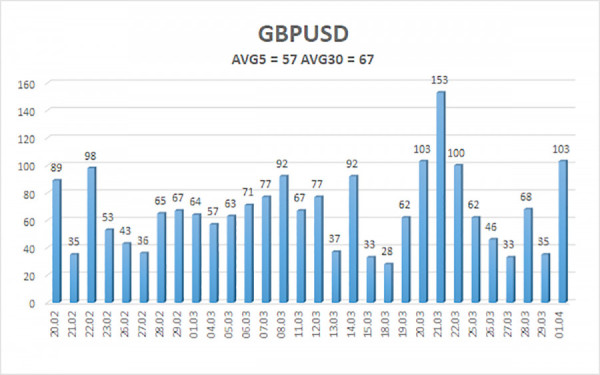
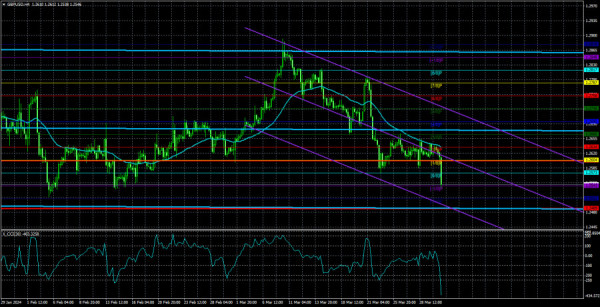
The average volatility of the GBP/USD pair over the last 5 trading days is 57 points. For the pound/dollar pair, this value is "low." Thus, on Tuesday, April 2nd, we expect movements within the range bounded by the levels of 1.2489 and 1.2603. The senior linear regression channel is still sideways, so there are no questions about the current trend. The CCI indicator entered the oversold zone on Monday, which may later this week provoke a new rise in the pair. The market is currently trading not too logically, which is not surprising given the ongoing flat on the 24-hour timeframe.
Nearest support levels:
S1 - 1.2543
S2 - 1.2512
Nearest resistance levels:
R1 - 1.2573
R2 - 1.2604
R3 - 1.2634
Trading recommendations:
The GBP/USD pair continues to trade in a flat over the 24-hour timeframe. We still expect movements to the south, now with targets at 1.2512 and 1.2489, and the market still extremely reluctantly buys the dollar and sells the pound, often ignoring the fundamental and macroeconomic background. Thus, first, the flat needs to end, and then analyze the technical picture for trading signals. Monday should not mislead traders into believing in the pound's decline.
Explanations for illustrations:
Linear regression channels - help determine the current trend. If both are directed in the same direction, it means the trend is currently strong.
The moving average line (settings 20.0, smoothed) - determines the short-term trend and the direction in which trading should be conducted.
Murray levels - target levels for movements and corrections.
Volatility levels (red lines) - the probable price channel in which the pair will spend the next day, based on current volatility indicators.
CCI indicator - its entry into the oversold zone (below -250) or overbought zone (above +250) indicates an approaching trend reversal in the opposite direction.