Performance in past “Fed pause” intervals supports the current S&P 500 rally

A performance comparison of key assets in the previous Fed pause periods
The S&P 500 index could go higher if history repeats itself
The US 10-year yield is expected to drop when the Fed decides to signal rate cuts
Considering the fact that the last rate hike was announced on July 26, 2023, the Fed is essentially entering the historical rate-cut window. Therefore, the next logical question is whether the key market assets are following any of the patterns recorded during the previous three Fed pause intervals?
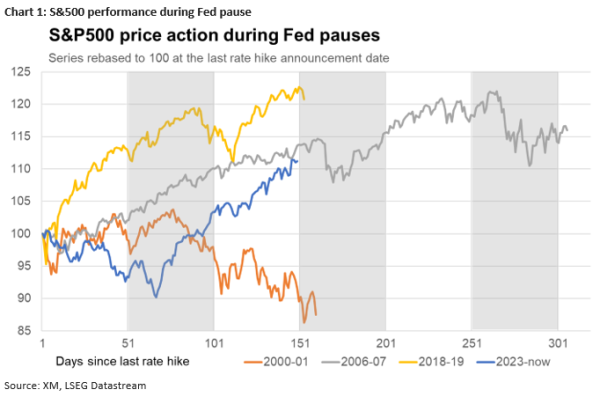
S&P 500 index could go even higherChart 1 below shows the S&P 500 index progression in the three aforementioned intervals and since the July 26, 2023 rate hike. The S&P 500 appears to record a performance similar to both the 2006-07 and 2018-19 periods. Consequently, the current aggressive rally seen in the global stock market is not uncommon, as the market tends to discount quickly the more favourable rates outlook and ignore any recession risks.
Additionally, an exact repeat of the S&P500 performance registered in both the 2006-07 and 2018-19 intervals means that the current rally could climb another 5-9% higher from current levels. Even more importantly, Chart 1 reveals that the Fed has in the past decided to start its monetary policy easing cycle despite the fact that the US stock indices were heading north and thus pointing to a brighter future ahead. This means that the current equities rally is not really closing the door to a Fed rate cut soon.
 US 10-year yield decreased in previous Fed pause intervals
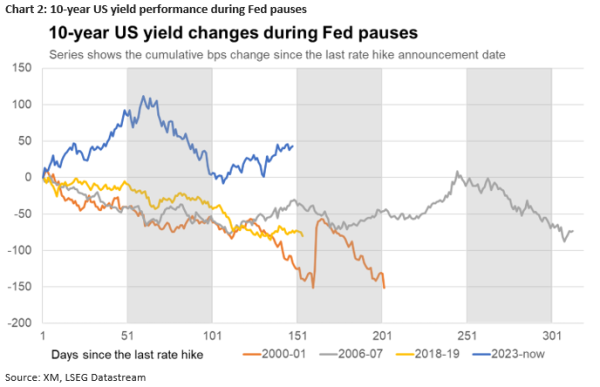
The picture becomes more interesting when considering the 10-year US yield movements in the three Fed pause intervals. As seen in Chart 2 below there is a shared trend of lower yields recorded in the time period between the last rate hike and the first rate cut. Interestingly, this trend is not repeated in the current interval as the 10-year US yield is currently 43bps higher than its July 26, 2023 level.
The current pricing could be interpreted in two ways. On the one hand, bond traders are acknowledging that rate cuts are not as close as anticipated at the start of 2024, confirming the current market pricing of the first 25bps rate move expected at the July 31 Fed gathering.
On the other hand, the Fed might be looking at the current elevated 10-year Treasury yield and concluding that it is still not the appropriate time to announce its rate cut intentions. Theoretically, a higher yield points to a stronger economic and inflation outlook, which naturally means that an economic slowdown, which would justify rate cuts, is not exactly around the corner.
Should the market eventually decide that rate cuts are coming, possibly on the back of weaker US data and/or more dovish rhetoric by the Fed, the 10-year US yield could drop by up to 152bps, making the 2.8% area a plausible target.
 Gold could climb higher; Euro/dollar has no specific historical pattern
Gold is an interesting case as in both the 2006-07 and 2018-19 intervals, it managed to climb higher. Gold is currently performing in line with these two periods, potentially opening the door to a stronger rally with an average target, if past performance is repeated, located in the $2,300 area.
On the flip side, euro/dollar is probably the least predictable security among the ones examined in this report as history does not point to a specific pattern. Having said that, the current euro/dollar performance appears to be following the same trend as in the 2018-19 period when EURUSD finished 3.2% lower. It is currently 2.2% lower and thus potentially has more some room to drop.
