S&P 500 Momentum Report
All eyes on upcoming US inflation data this week
A quieter start on the economic calendar and a slew of key US inflation releases ahead have put a stall on the recovery rally in Wall Street but this will likely not stay for long, as the upcoming inflation data will be on watch to anchor expectations around the Federal Reserve (Fed)’s policy path ahead. With attention now tilted towards the soft landing debate, market participants will be hoping to see a more gradual moderation in pricing pressures as an indication that demand conditions remain well-supported.
As a precursor to US consumer prices this week, the US producer price index (PPI) release today is expected to show headline PPI easing to 2.3% from 2.6% prior, while the core aspect is expected to ease to 2.7% from the 3% prior.
With the VIX now back at its 20 level, which is generally looked upon as a divide between high-volatile periods and normal times, the prices data will be crucial in driving risk sentiments ahead. The worst-case scenario for markets will be an unexpected revival in inflationary pressures, which, given recent jitters around US economic growth, may spur talks of stagflation.
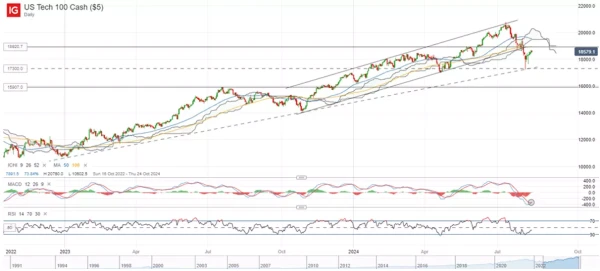
Nasdaq 100: 200-day MA defended for now
The Nasdaq 100 index has recovered close to 5% from last Monday’s rout, having found a support confluence at the 17,300 level, where a key upward trendline runs alongside its 200-day moving average (MA). The formation of a daily bullish hammer at this level suggests some dip-buying in place, which is accompanied by a bullish crossover on its daily moving average convergence/divergence (MACD).
Ahead, the 18,580 level may serve as immediate resistance to overcome, which marked a 38.2% Fibonacci retracement level with the recent correction. Overcoming this level may pave the way for the index to retest the 19,000 level next. For now, its daily relative strength index (RSI) is heading back towards its mid-line. Perhaps more for a confirmation, any move above the mid-line could suggest buyers in greater control, which raises the odds that a near-term bottom has been formed.
Levels:
R2: 19,000
R1: 18,580
S1: 17,300
S2: 15,900
Source: IG charts
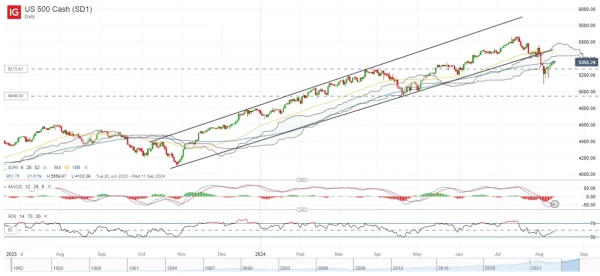
S&P 500: Awaiting further catalysts as recovery stalls
The S&P 500 has recovered more than 5% from last Monday’s rout, as some expectations are in place that recession concerns may be overblown. That said, gains for the index has stalled into the new week, as the lead-up to the US inflation data release called for some near-term caution. Having broken below a rising channel pattern at the start of the month, the lower channel trendline at the 5,480 level may now serve as resistance to overcome, which coincides with the upper edge of its daily Ichimoku Cloud. On any downside, last Monday’s low at the 5,100 level will be on watch as support to hold.
Levels:
R2: 5,674
R1: 5,480
S1: 5,279
S2: 5,100
Source: IG charts
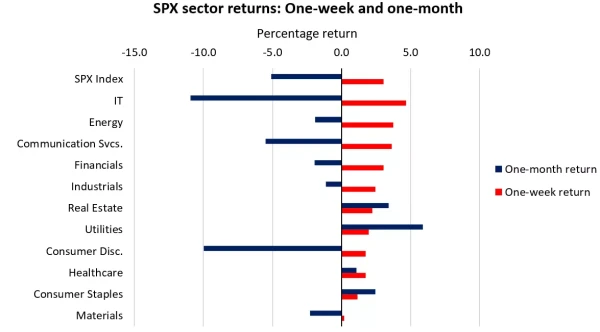
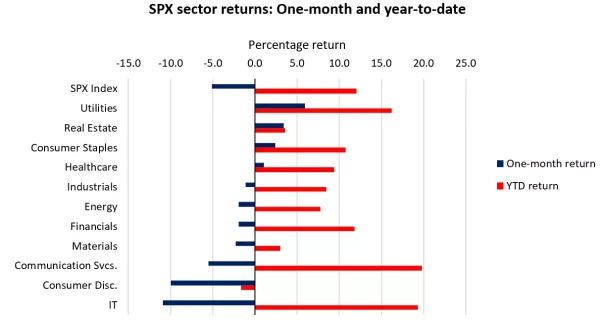
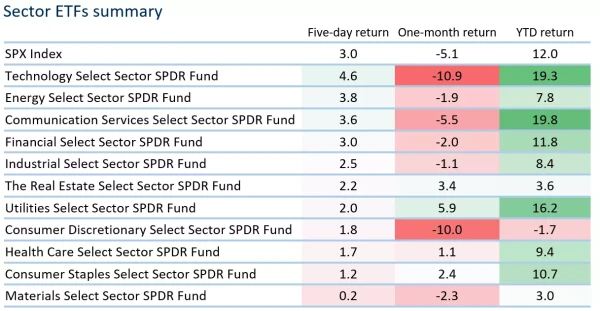
Sector performance
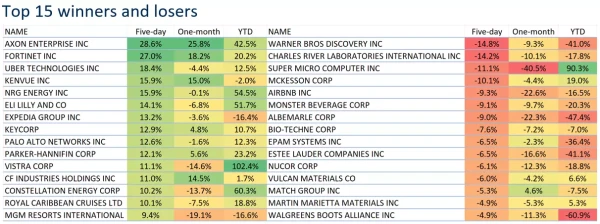
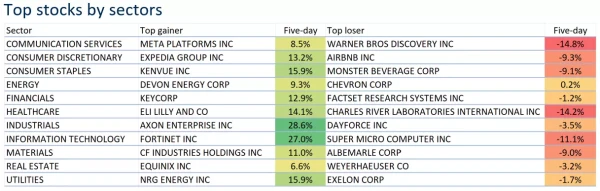
Sector performance over the past one month has revealed a clear lean to the defensives, with utilities leading the pack with a 5.9% gain as recession chatters dominated the headlines. The pricing for more aggressive rate cuts from the US Fed has triggered some catch-up performance for the real estate sector as well, which has been one of the underperformers year-to-date. Over the past week, the risk environment has since improved, as resilient US economic data questions if markets are getting ahead of themselves in pricing for a hard landing. There has been a broad-based recovery across all S&P 500 sectors, with the broader index up 3.0% for the week. The technology sector continues to pull ahead on strength in semiconductors, with AI-leader Nvidia up 8.5%. Other Magnificent Seven stocks shone as well, with Meta up 8.5%, while Apple Inc (All Sessions) and Amazon were up close to 4%.
Source: Refinitiv
Source: Refinitiv
Source: Refinitiv
*Note: The data is from 6th – 12th August 2024.
Source: Refinitiv
*Note: The data is from 6th – 12th August 2024.
Source: Refinitiv
*Note: The data is from 6th – 12th August 2024.