🔎S&P 500 Q2 2024 earnings season summary 📊
In analysing the ongoing earnings season in the US, let's start with the apparent trend, which until recently has been a retreat from technology stocks (BigTech) and an influx of capital into the DJIA and Russell 2000 indices. As a result, both of these indices have behaved better than the broad market. As concerns about macro health increase, however, the sell-off is beginning to be seen among stocks from these indexes as well.
Nonetheless, it seems that investors chose lower valued and more defensive stocks, in which they planned to 'wait out' the ongoing period of surging volatility, ahead of the US elections. Nearly half of the companies in the S&P 500 index have already reported results, according to FactSet data. So how is the ongoing earnings season shaping up for S&P 500 companies, and what does it tell us about the prosperity of the US economy?
Q2 2024 S&P 500 earnings Summary
The U.S. earnings season has not been perfect, and we can't count it as exceptionally successful. About 78% of company stocks beat earnings forecasts (the 5-year average is 74% and the 10-year average is 77%) by an average of about 4.4% (the 5-year average is 8.6% and the 10-year average is 6.8%),
- Expected revenue beats 60% of companies, by an average of about 1.1% (5-year average 2% and 10-year average 1.4%). Thus, both results measuring the magnitude of the positive surprise are below the 5-year and 10-year averages. The percentage of companies reporting revenues above forecasts (63%) is also below the 5-year average of 69% and the 10-year average of 64%. Health care and industrial companies are the best performers (lower expectations).
- Corporate earnings are growing at an average rate of 9.8% y/y, and if this rate continues it will be the highest growth since Q4 2021 (31.4%, due to the base effect). As of June 30, the market expected growth of 8.9% y/y. For Q3 2024, a total of 16 S&P 500 companies issued negative earnings-per-share forecasts, while 16 issued positive ones
- The net profit margin for the S&P 500 for Q2 2024 is about 12.1%, above the net profit margin of a year ago. 11.6%, above the 5-year average of 11.5% and above the net profit margin of the previous quarter, when it was 11.8%. Technology companies report higher y/y net margins of 24.9% vs. 23.3% in Q2 2023
- Ten sectors reported year-on-year revenue growth, led by the technology sector. The materials sector was the only one to report a decline in revenue. Wall Street now expects year-on-year earnings growth of 6.8% and 16.7% in Q3 2024 and Q4 2024, respectively,
- For the full year 2024, analysts are counting on nearly 11% y/y profit growth i.e. above the current quarter's growth rate. Investors are pricing full-year 2024 net margins to remain above 12% and higher than in the current quarter (12.4% for Q3 and Q4). A slowing economy may lead to a revision of these expectations.
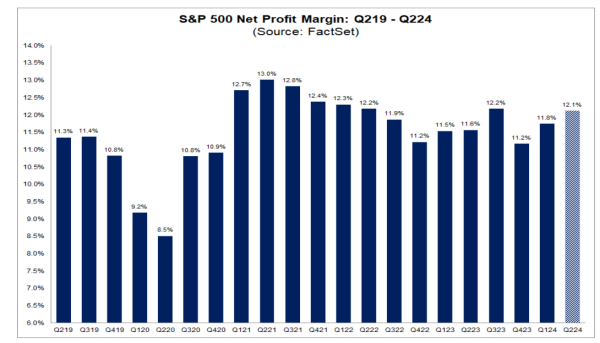 A seasonally weaker Q2 brought solid net margins to S&P 500 companies.Source: FactSet
Nvidia supports Wall Street
Nvidia is the biggest contributor to growth in the technology sector, which has the highest annual revenue growth rate of the 11 S&P 500 sectors, with 9.7% y/y. Revenues in the semiconductor and hardware sector grew by an average of 25% y/y in Q2 2024, while software grew slightly weaker, around 12%.
However, if Nvidia were excluded, the total revenue growth rate for the information technology sector would be 'only' 6.1% y/y. What's more, without Nvidia, technology companies' profits would have grown by 7.8% y/y instead of an impressive 17.2% y/y. Profits are strongest in the semiconductor and technology equipment sector, as well as memory and so-called peripherals (up 51% y/y). Noticeably weaker in the software sector, 'only' by 8% y/y.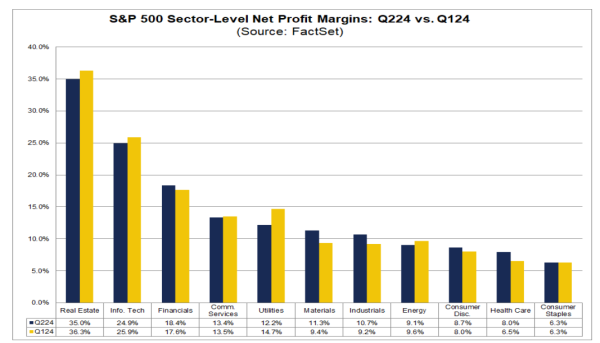
Net margins in the technology sector fell to 24.9%, compared to 25.9% in Q1 2024. However, they remain above the 5-year average at 23.7% and are higher y/y when they were 23.3%. Source: FactSet
US500
Today, US500 contracts are performing poorly and are trading 1.5% oversold, approaching the vicinity of the local low, after rolling over from the second half of June. Currently, the 12-month price-to-earnings ratio for the S&P 500 index is 20.6 slightly lower than the 21 at the end of Q2, but above the 5-year average at 19.3 and the 10-year average at 17.9. Investors may be concerned that in a slowdown scenario, without a soft landing, earnings growth estimates are overstated. Investors are counting on a 9.5% y/y increase in S&P500 earnings this year and a 7.2% growth rate excluding technology companies and 11.2% excluding financial companies.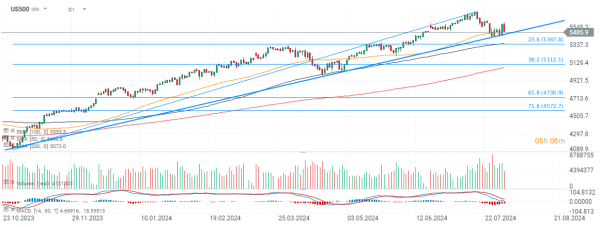
Source: xStation5