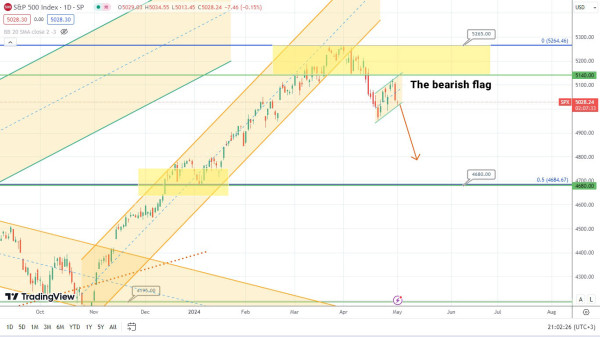
S&P500 Forecast: Potential Price Reversal Ahead
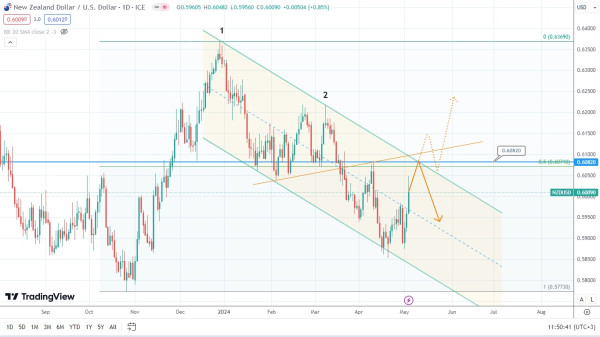
The daily timeframe of the New Zealand Dollar shows the newly formed downtrend between the points 0.6369 and 0.6216 as well as the horizontal level of 0.6082. This level almost coincides with the 50% Fibonacci retracement from the latest ascending move. The price of the currency pair NZD/USD is likely to rebound at the crossing point of the abovementioned technical trendlines. On the other hand, the asset’s price might break the downtrend and rise again. This scenario is denoted by the dashed line on the chart below. So, let’s observe which of these two scenarios is likely to work out.
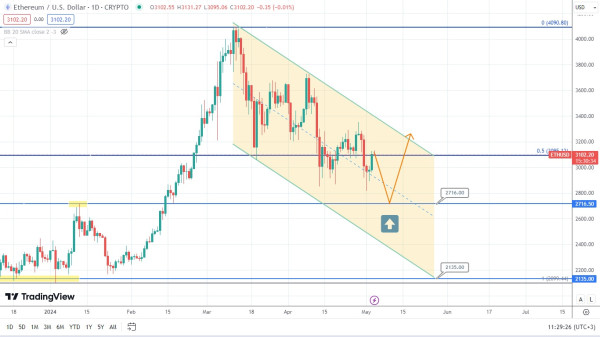
The price of Ethereum is gradually undergoing correction and heading down. Currently, the price of this asset is testing the broken level of 3100. It might potentially drop and gain the required support at the level of 2716. After that, the price of ETH might rise. So, let’s observe what the next price movement of this asset might be.
Last Friday, the price of the American stock index S&P500 formed a single small candlestick pattern next to the broken level of 5140. This might signify the upcoming formation of the shooting star and a very strong reversal pattern such as an abandoned baby at the beginning of the next trading week. This pattern, would be exceptionally strong as it would be located below the broken level. Also, the chart shows the upcoming formation of the bearish flag, which might finally be completed during the next week.