TAG: USDIDR
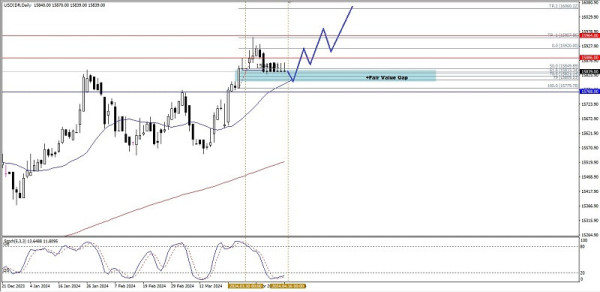
Technical Analysis of Daily Price Movement of USD/IDR Exotic Currency Pairs, Tuesday April 16, 2024.
If you look at the daily chart, the exotic currency pair USD/IDR appears to be moving above its 200 MA and the Stochastic indicator which is already at the oversold level and is stuck at the level of the Bullish Fair Value Gap area which acts like a level...
6 months ago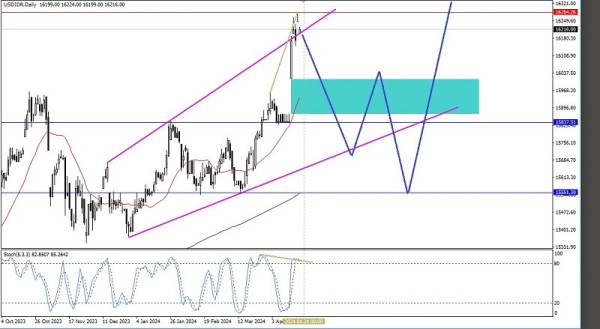
Technical Analysis of Daily Price Movement of USD/IDR Exotic Currency Pairs , Monday April 22, 2024.
Based on the daily chart of the exotic currency pair USD/IDR, there is potential for correction of the weakening of the United States Dollar against the Garuda currency (Rupiah) as indicated by the appearance of the Ascending Broadening Wedge pattern and...
5 months ago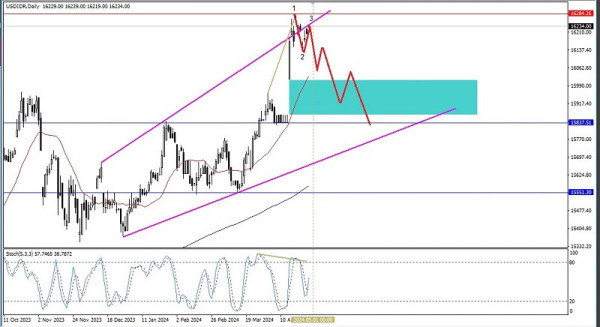
Technical Analysis of Daily Price Movement of USD/IDR Exotic Currency Pairs , Monday April 29, 2024.
Even though the condition on the daily chart of the exotic currency pair USD/IDR is in a strengthening condition, the emergence of a deviation pattern between the USD/IDR price movement and the Stochastic Oscillator indicator as well as the presence of th...
5 months ago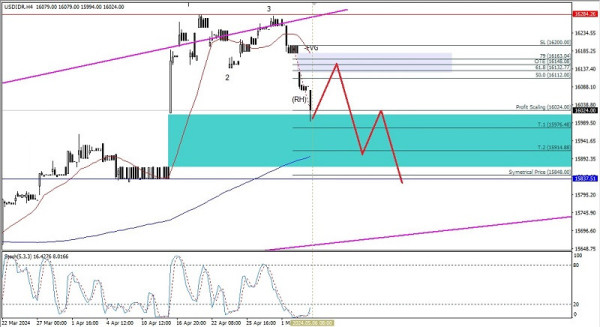
Technical Analysis of Intraday Price Movement of USD/IDR Exotic Currency Pairs , Monday May 06, 2024.
With the appearance of the Bearish 123 pattern on the 4 hour chart of the exotic currency pair USD/IDR even though the MA 20 condition is still above the MA 200, this indicates that in the near future USD/IDR still has the potential to continue its weaken...
5 months ago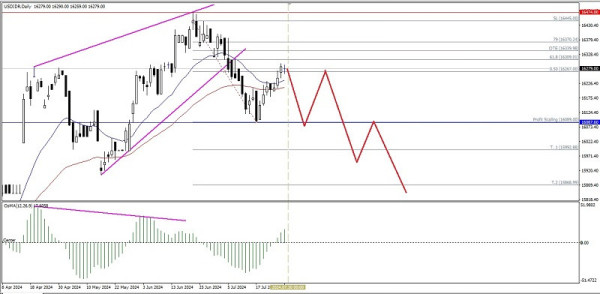
Technical Analysis of Daily Price Movement of USD/IDR Exotic Currency Pairs , Monday July 29, 2024.
If we look at the daily chart of the exotic currency pair USD/IDR, there are several interesting things, first the appearance of the Rising Wedge pattern, second there is a deviation between the movement of the USD/IDR currency price and the MACD Histogra...
2 months ago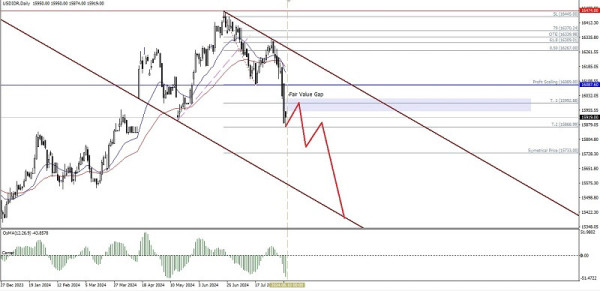
Technical Analysis of Daily Price Movement of USD/IDR Exotic Currency Pairs , Monday August 12, 2024.
It seems that the USD currency is still weakening against the Garuda currency where in the daily chart the price movement is seen moving in a downward channel and the price movement is below the EMA 20 & EMA 50 so that in the next few days as long as...
2 months ago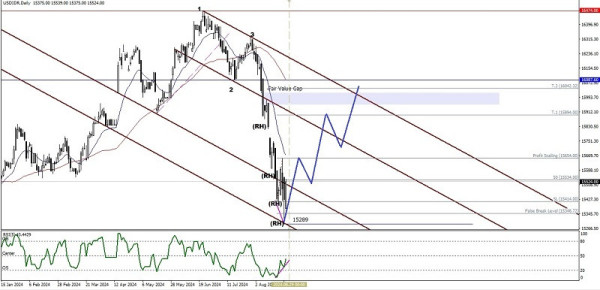
Technical Analysis of Daily Price Movement of USD/IDR Exotic Currency Pairs, Tuesday August 27, 2024.
With the formation of a channel that dives down and the movement of the USD/IDR price that forms a deviation between its price movement and the RSI indicator (5) and fails to breaks and close below the level of 15348.72, it gives an indication that in the...
1 month ago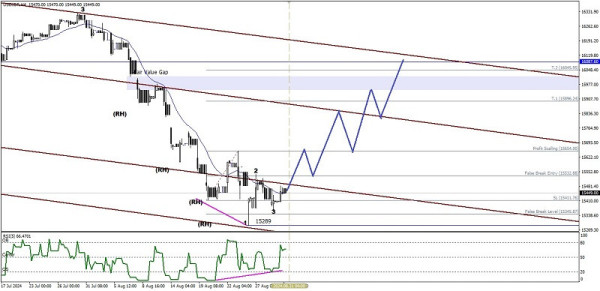
Technical Analysis of Intraday Price Movement of USD/IDR Exotic Currency Pairs, Monday September 02, 2024.
On the 4-hour chart, the Exotic USD/IDR currency pair appears to have a Bullish 123 pattern and a deviation between its price movement and the RSI indicator (5) which gives an indication and confirmation that the USD in the near future has the potential t...
1 month ago