Technical Analysis – Apple stock holds a bullish bias
Apple capped by 20- and 50-day SMAs
Prices stand above uptrend line
Momentum oscillators show neutral-to-bullish mode
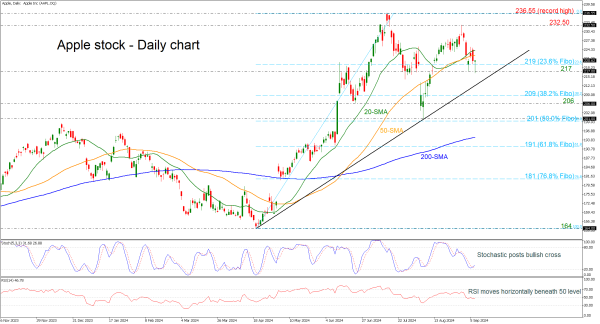
Immediate resistance is coming from the 50- and then the 20-day simple moving averages (SMAs) at 222 and 224 respectively. If the bulls surpass successfully these lines, then the market could need some boost to retest the previous peaks of 232.50 and 236.55.
On the other hand, a slip beneath the 217-219 support area could drive traders to the medium-term uptrend line and a break below it would increase downside pressures. The next level for the bears to have in mind is the 38.2% Fibonacci at 209.
The technical oscillators are indicating a neutral-to-bullish movement. The stochastic posted a bullish crossover within its %K and %D lines above the oversold area, while the RSI is flattening below the 50 level.
All in all, Apple stock price added more than 44% since April 19 and only a move beneath the 200-day SMA at 194 could change the current view.