Technical Analysis – AUDUSD posts new 9-month high
AUDUSD rally continues after bounce off 200-day SMA
Technical oscillators are mixed
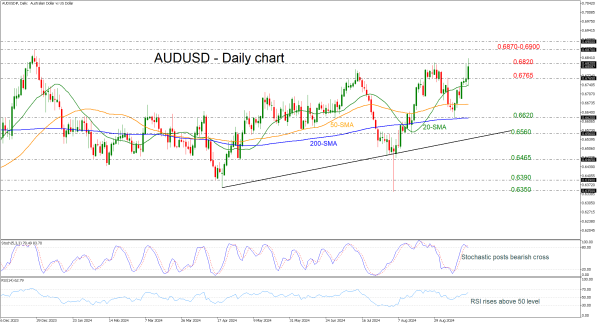
AUDUSD has printed a fresh nine-month high of 0.6838 earlier today, creating the fourth consecutive green candle. The pair found significant support at the 200-day simple moving average (SMA) at 0.6620, continuing the medium-term bullish structure.
The technical oscillators are showing some contradicting sings in the daily chart. The stochastic posted a bearish crossover within its %K and %D lines in the overbought region; however, the RSI is keep rising momentum above the 50 territory.
More upside pressure could open the way for a test of the 0.6870-0.6900 resistance region, taken from the highs in December 2023 and in June 2023.
Alternatively, a decline below the 0.6765 support could raise the speculation for a negative correction taking the market until the 50-day SMA at 0.6670 and then towards the 0.6620 barricade.
All in all, AUDUSD has been in a bullish tendency since April and only a dive below the uptrend line could change the current outlook.